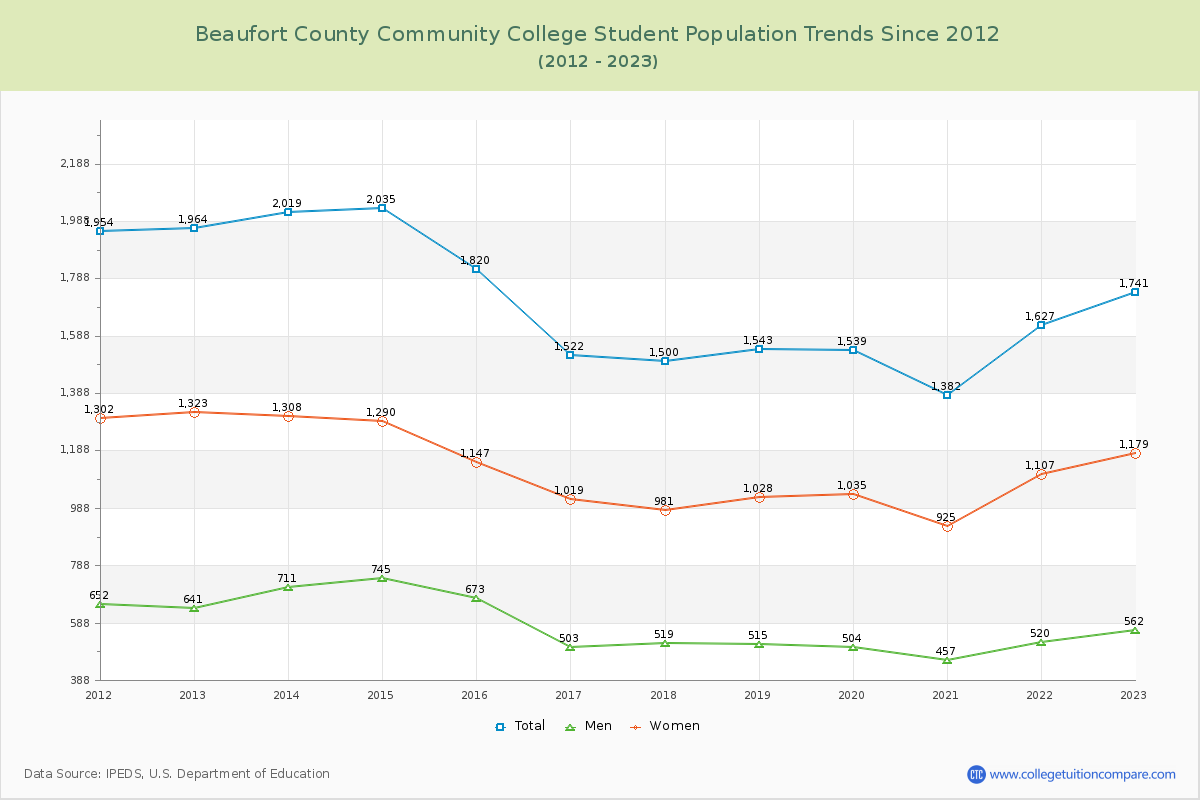
Student Population Changes
The average student population over the last 12 years is 1,699 where 1,741 students are attending the school for the academic year 2022-2023.
The female to male ratio is 2.10 to 1 and it means that there are far more female students enrolled in Beaufort County CC than male students.
The following table and chart illustrate the changes in student population by gender at Beaufort County Community College since 2012.
| Year | Total | Men | Women |
|---|---|---|---|
| 2012-13 | 1,964 | 641 | 1,323 |
| 2013-14 | 2,019 55 | 711 70 | 1,308 -15 |
| 2014-15 | 2,035 16 | 745 34 | 1,290 -18 |
| 2015-16 | 1,820 -215 | 673 -72 | 1,147 -143 |
| 2016-17 | 1,522 -298 | 503 -170 | 1,019 -128 |
| 2017-18 | 1,500 -22 | 519 16 | 981 -38 |
| 2018-19 | 1,543 43 | 515 -4 | 1,028 47 |
| 2019-20 | 1,539 -4 | 504 -11 | 1,035 7 |
| 2020-21 | 1,382 -157 | 457 -47 | 925 -110 |
| 2021-22 | 1,627 245 | 520 63 | 1,107 182 |
| 2022-23 | 1,741 114 | 562 42 | 1,179 72 |
| Average | 1,699 | 577 | 1,122 |