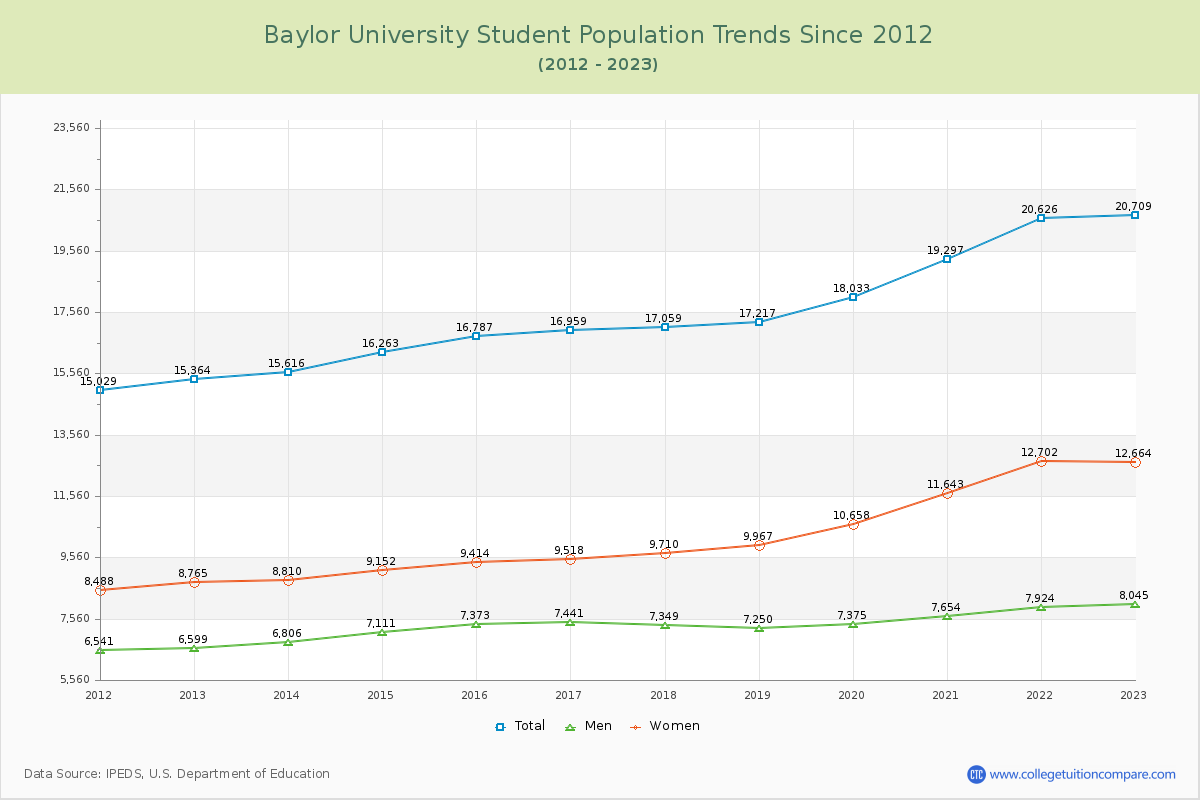
Student Population Changes
The average student population over the last 12 years is 17,630 where 20,709 students are attending the school for the academic year 2022-2023.
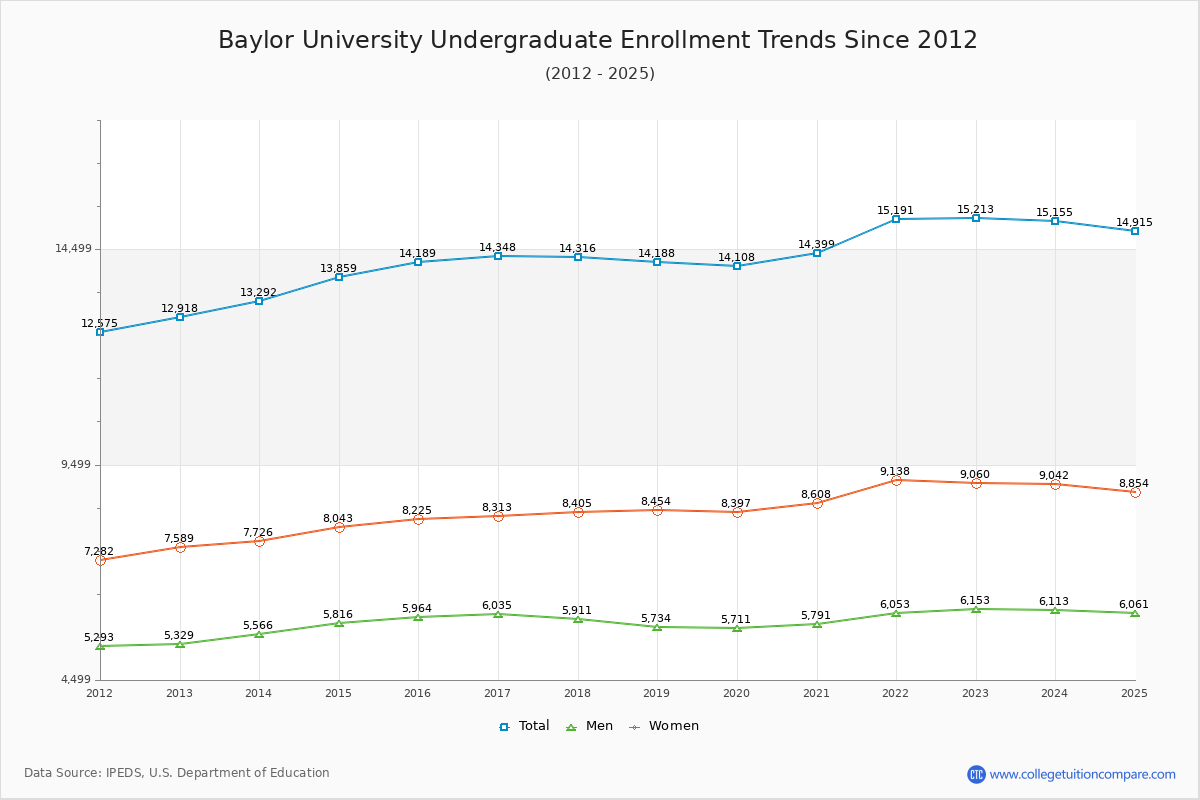
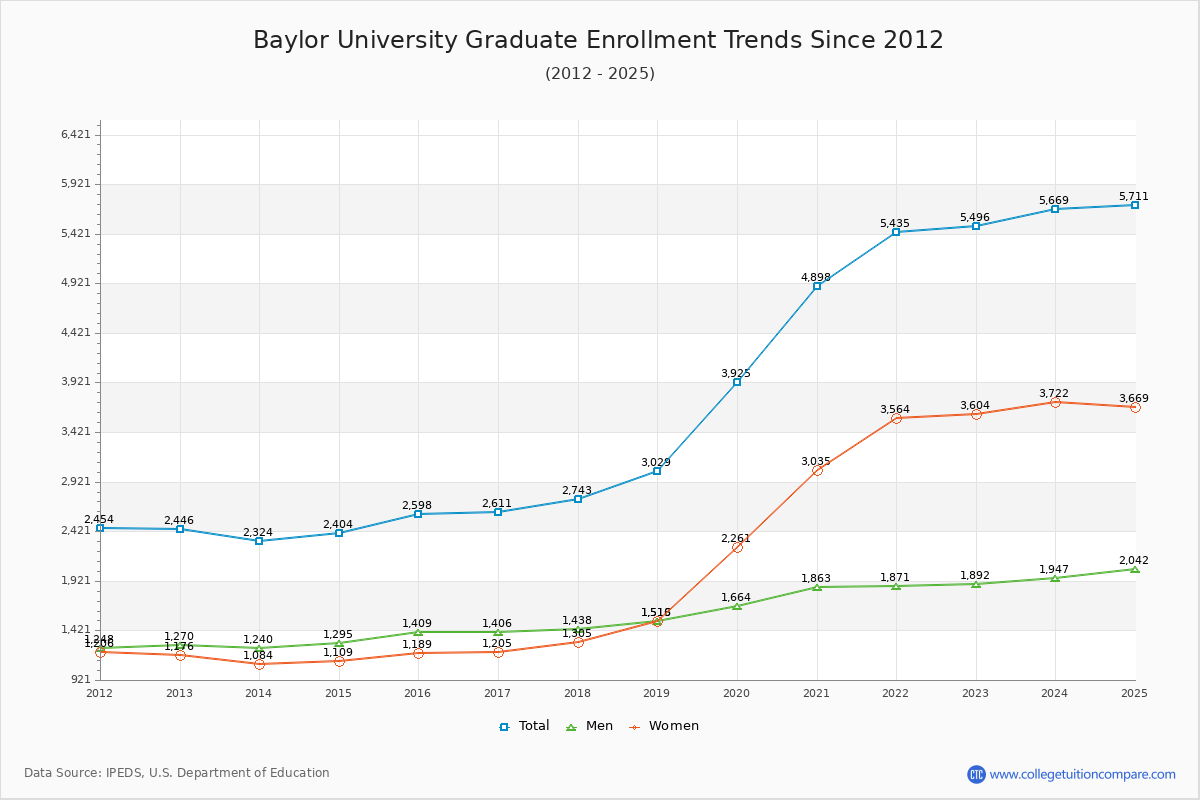
73.46% of total students is undergraduate students and 26.54% students is graduate students. The number of undergraduate students has increased by 2,295 and the graduate enrollment has increased by 3,050 over past 10 years.
The female to male ratio is 1.57 to 1 and it means that there are more female students enrolled in Baylor than male students.
The following table and chart illustrate the changes in student population by gender at Baylor University since 2012.
| Year | Total | Undergraduate | Graduate | ||||
|---|---|---|---|---|---|---|---|
| Total | Men | Women | Total | Men | Women | ||
| 2012-13 | 15,364 | 12,918 | 5,329 | 7,589 | 2,446 | 1,270 | 1,176 |
| 2013-14 | 15,616 252 | 13,292 374 | 5,566 237 | 7,726 137 | 2,324 -122 | 1,240 -30 | 1,084 -92 |
| 2014-15 | 16,263 647 | 13,859 567 | 5,816 250 | 8,043 317 | 2,404 80 | 1,295 55 | 1,109 25 |
| 2015-16 | 16,787 524 | 14,189 330 | 5,964 148 | 8,225 182 | 2,598 194 | 1,409 114 | 1,189 80 |
| 2016-17 | 16,959 172 | 14,348 159 | 6,035 71 | 8,313 88 | 2,611 13 | 1,406 -3 | 1,205 16 |
| 2017-18 | 17,059 100 | 14,316 -32 | 5,911 -124 | 8,405 92 | 2,743 132 | 1,438 32 | 1,305 100 |
| 2018-19 | 17,217 158 | 14,188 -128 | 5,734 -177 | 8,454 49 | 3,029 286 | 1,516 78 | 1,513 208 |
| 2019-20 | 18,033 816 | 14,108 -80 | 5,711 -23 | 8,397 -57 | 3,925 896 | 1,664 148 | 2,261 748 |
| 2020-21 | 19,297 1,264 | 14,399 291 | 5,791 80 | 8,608 211 | 4,898 973 | 1,863 199 | 3,035 774 |
| 2021-22 | 20,626 1,329 | 15,191 792 | 6,053 262 | 9,138 530 | 5,435 537 | 1,871 8 | 3,564 529 |
| 2022-23 | 20,709 83 | 15,213 22 | 6,153 100 | 9,060 -78 | 5,496 61 | 1,892 21 | 3,604 40 |
| Average | 17,630 | 14,184 | 5,824 | 8,360 | 3,446 | 1,533 | 1,913 |