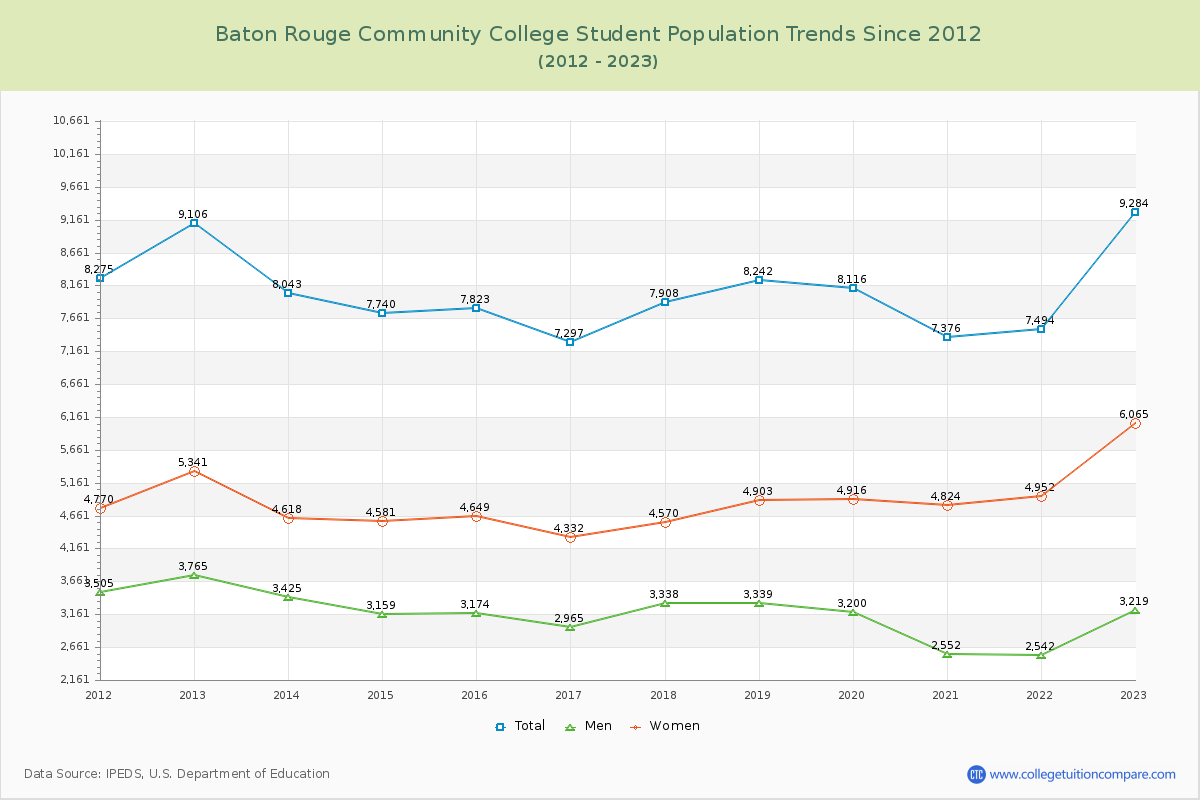
Student Population Changes
The average student population over the last 12 years is 8,039 where 9,284 students are attending the school for the academic year 2022-2023.
The female to male ratio is 1.88 to 1 and it means that there are more female students enrolled in BRCC than male students.
The following table and chart illustrate the changes in student population by gender at Baton Rouge Community College since 2012.
| Year | Total | Men | Women |
|---|---|---|---|
| 2012-13 | 9,106 | 3,765 | 5,341 |
| 2013-14 | 8,043 -1,063 | 3,425 -340 | 4,618 -723 |
| 2014-15 | 7,740 -303 | 3,159 -266 | 4,581 -37 |
| 2015-16 | 7,823 83 | 3,174 15 | 4,649 68 |
| 2016-17 | 7,297 -526 | 2,965 -209 | 4,332 -317 |
| 2017-18 | 7,908 611 | 3,338 373 | 4,570 238 |
| 2018-19 | 8,242 334 | 3,339 1 | 4,903 333 |
| 2019-20 | 8,116 -126 | 3,200 -139 | 4,916 13 |
| 2020-21 | 7,376 -740 | 2,552 -648 | 4,824 -92 |
| 2021-22 | 7,494 118 | 2,542 -10 | 4,952 128 |
| 2022-23 | 9,284 1,790 | 3,219 677 | 6,065 1,113 |
| Average | 8,039 | 3,153 | 4,886 |