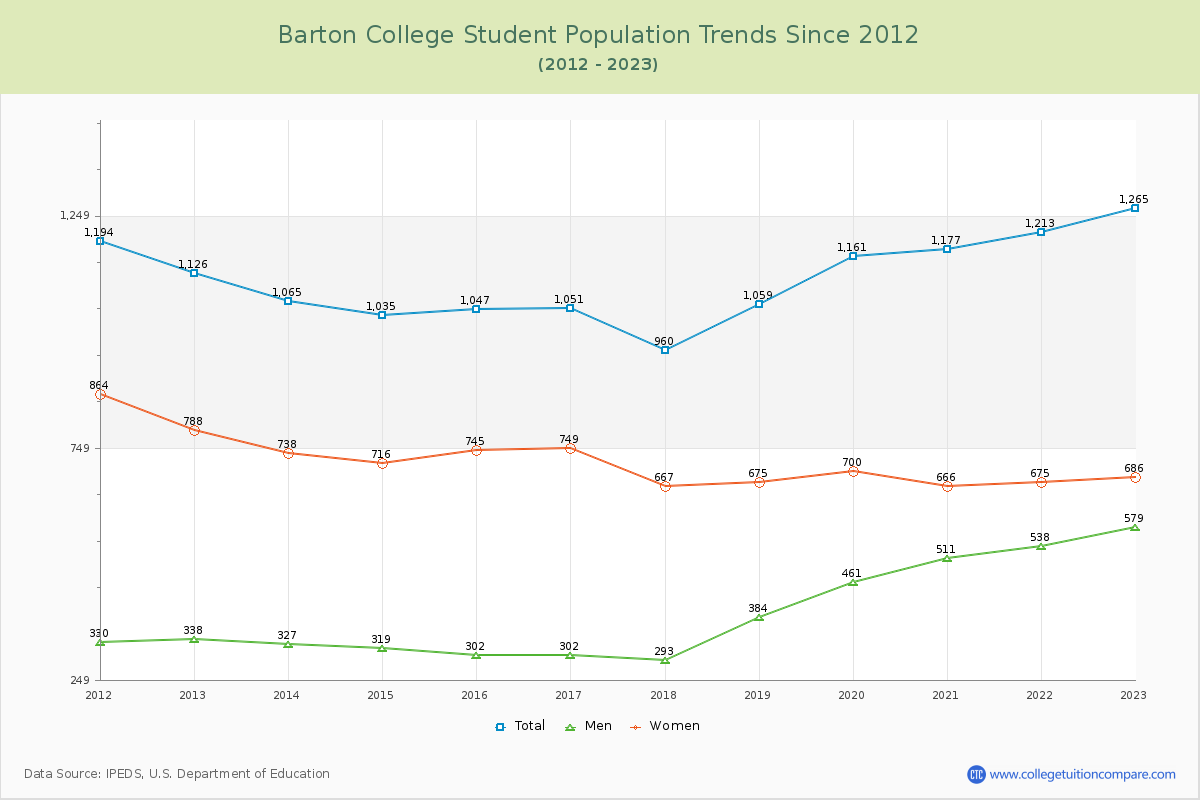
Student Population Changes
The average student population over the last 12 years is 1,105 where 1,265 students are attending the school for the academic year 2022-2023.
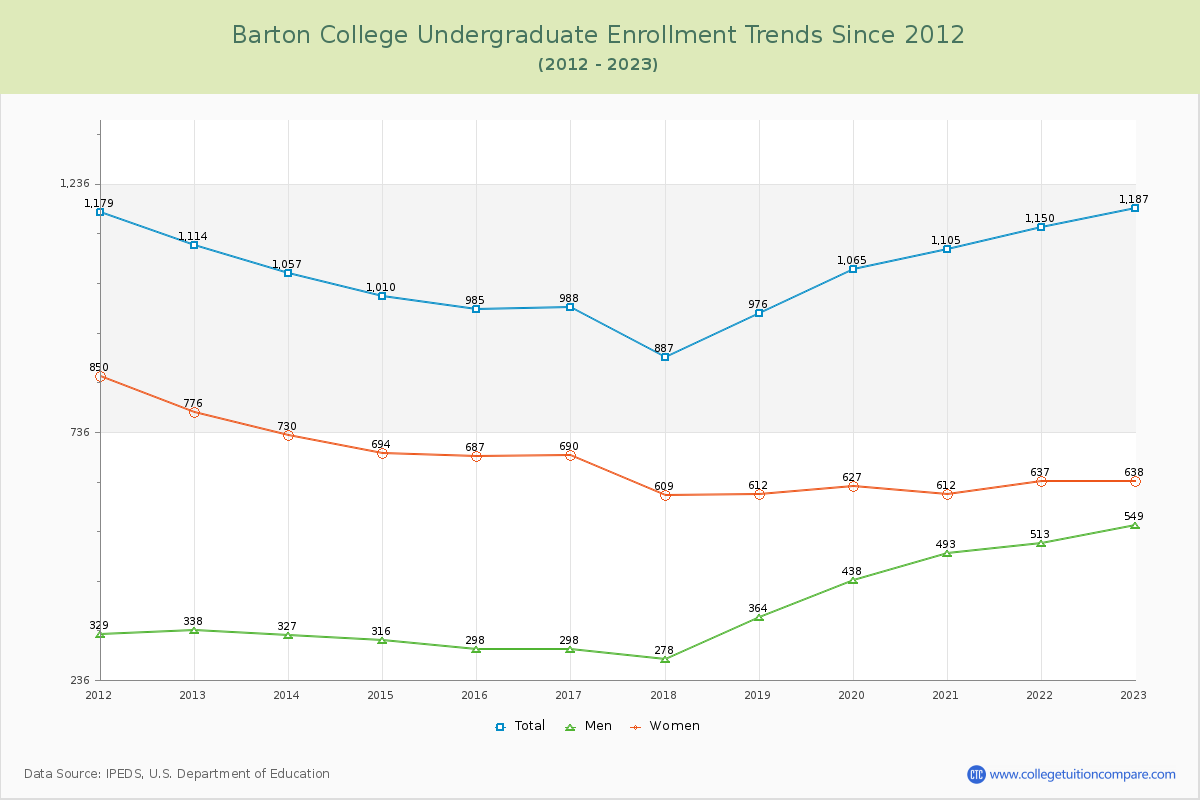
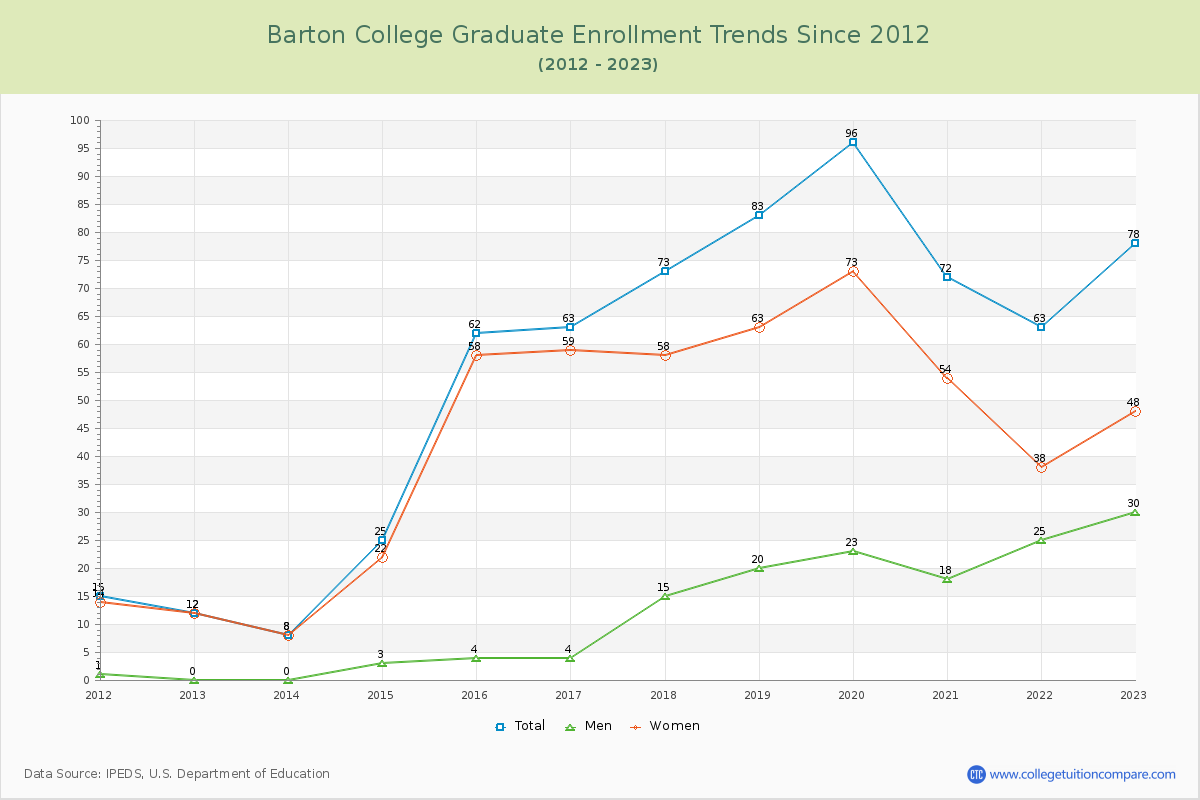
93.83% of total students is undergraduate students and 6.17% students is graduate students. The number of undergraduate students has increased by 73 and the graduate enrollment has increased by 66 over past 10 years.
The female to male ratio is 1.18 to 1 and it means that there are slightly more female students enrolled in Barton than male students.
The following table and chart illustrate the changes in student population by gender at Barton College since 2012.
| Year | Total | Undergraduate | Graduate | ||||
|---|---|---|---|---|---|---|---|
| Total | Men | Women | Total | Men | Women | ||
| 2012-13 | 1,126 | 1,114 | 338 | 776 | 12 | 0 | 12 |
| 2013-14 | 1,065 -61 | 1,057 -57 | 327 -11 | 730 -46 | 8 -4 | 0 0 | 8 -4 |
| 2014-15 | 1,035 -30 | 1,010 -47 | 316 -11 | 694 -36 | 25 17 | 3 3 | 22 14 |
| 2015-16 | 1,047 12 | 985 -25 | 298 -18 | 687 -7 | 62 37 | 4 1 | 58 36 |
| 2016-17 | 1,051 4 | 988 3 | 298 0 | 690 3 | 63 1 | 4 0 | 59 1 |
| 2017-18 | 960 -91 | 887 -101 | 278 -20 | 609 -81 | 73 10 | 15 11 | 58 -1 |
| 2018-19 | 1,059 99 | 976 89 | 364 86 | 612 3 | 83 10 | 20 5 | 63 5 |
| 2019-20 | 1,161 102 | 1,065 89 | 438 74 | 627 15 | 96 13 | 23 3 | 73 10 |
| 2020-21 | 1,177 16 | 1,105 40 | 493 55 | 612 -15 | 72 -24 | 18 -5 | 54 -19 |
| 2021-22 | 1,213 36 | 1,150 45 | 513 20 | 637 25 | 63 -9 | 25 7 | 38 -16 |
| 2022-23 | 1,265 52 | 1,187 37 | 549 36 | 638 1 | 78 15 | 30 5 | 48 10 |
| Average | 1,105 | 1,048 | 383 | 665 | 58 | 13 | 45 |