Enrollment Trends at Baptist Health Sciences

-188

Total Enrollment

10

Men

-198

Women

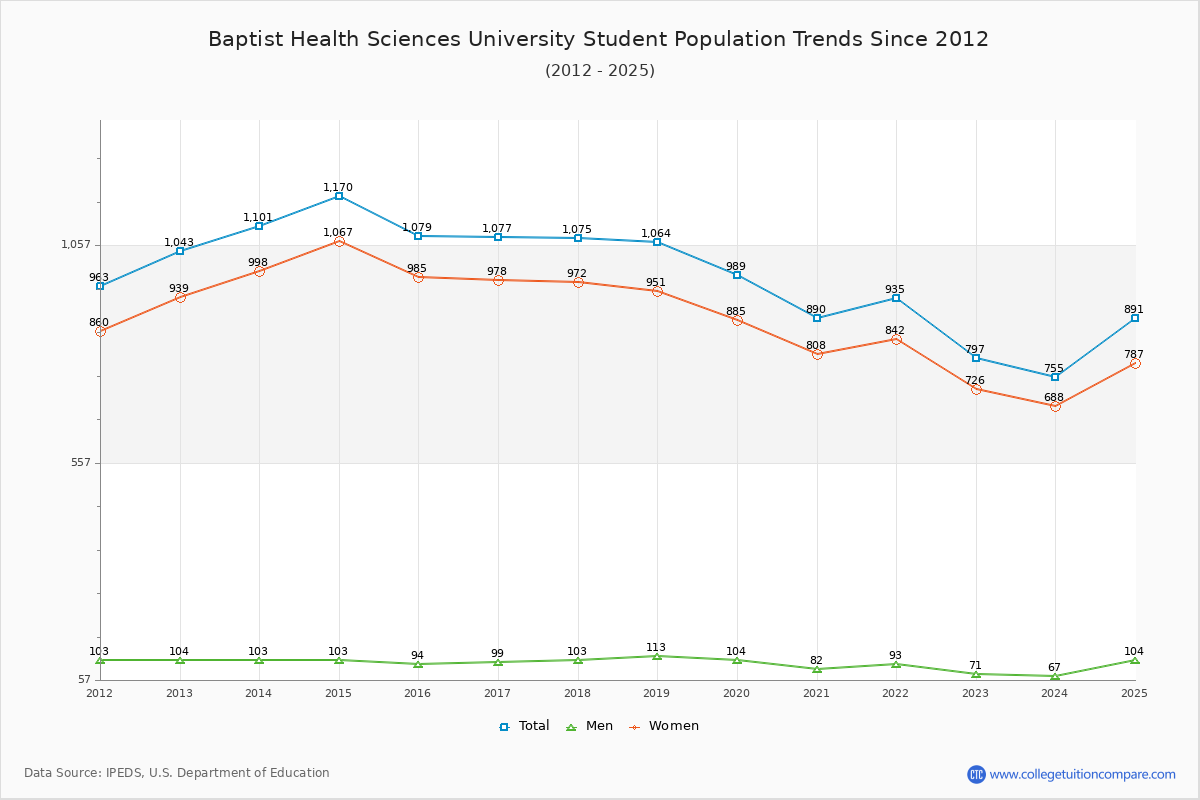
The student population at Baptist Health Sciences University is 891 (782 undergraduate and 109 graduate students) . The number of students has decreased by 188 over the past decade.

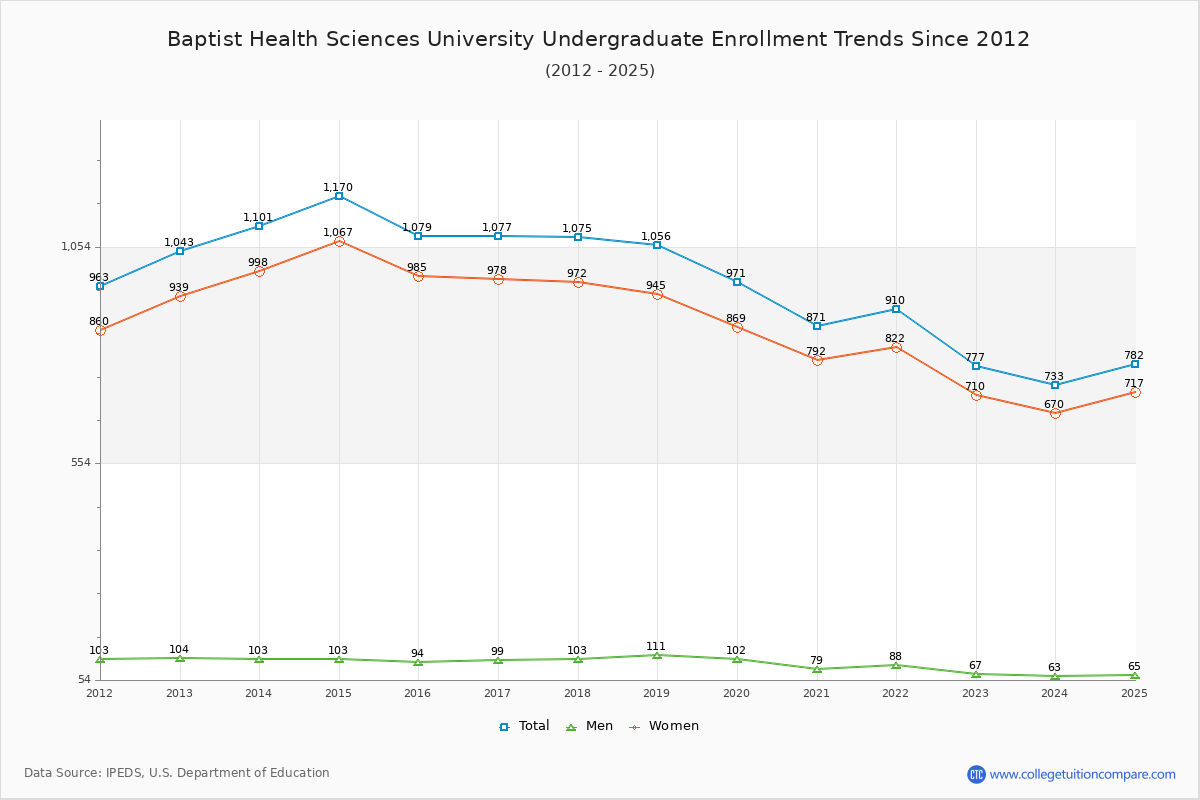
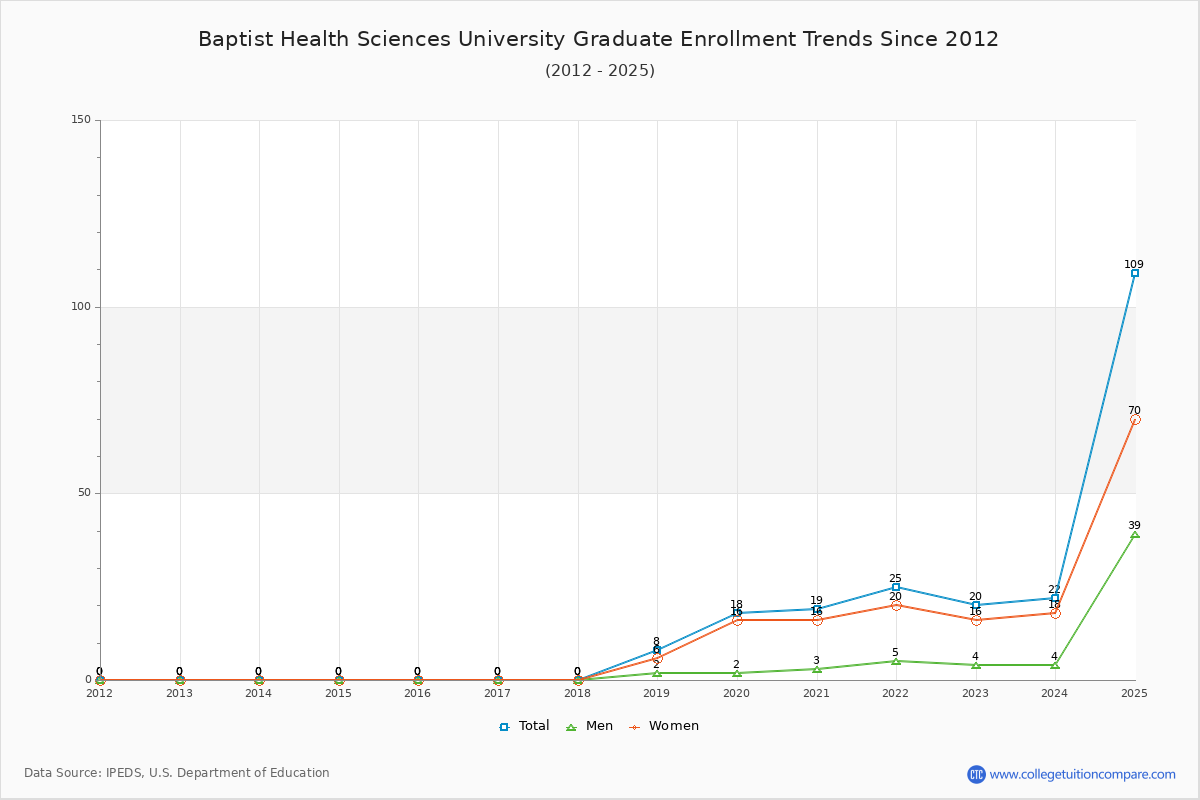
The percentage of undergraduate students at Baptist Health Sciences is 87.77% which is decreased by 297 over last 10 years. The graduate student population increased by 109 and it has been increasing.

The female to male ratio is 7.57 to 1 which means that majority of population is on female students.

100 students enrolled in online degree program exclusively and the number of online students has increased by 354.55% since 2015.

Student Population Changes

The average student population over the last 11 years is 955 where 891 students are attending the school for the academic year 2024-2025.

87.77% of total students is undergraduate students and 12.23% students is graduate students. The number of undergraduate students has decreased by 297 and the graduate enrollment has increased by 109 over past 10 years.

The female to male ratio is 7.57 to 1 and it means that there are far more female students enrolled in Baptist Health Sciences than male students.

The following table and chart illustrate the changes in student population by gender at Baptist Health Sciences University since 2015.

YearTotalUndergraduateGraduate
TotalMenWomenTotalMenWomen
2015-161,0791,07994985000
2016-171,077
-2
1,077
-2
99
5
978
-7
000
2017-181,075
-2
1,075
-2
103
4
972
-6
000
2018-191,064
-11
1,056
-19
111
8
945
-27
8
8
2
2
6
6
2019-20989
-75
971
-85
102
-9
869
-76
18
10
216
10
2020-21890
-99
871
-100
79
-23
792
-77
19
1
3
1
16
2021-22935
45
910
39
88
9
822
30
25
6
5
2
20
4
2022-23797
-138
777
-133
67
-21
710
-112
20
-5
4
-1
16
-4
2023-24755
-42
733
-44
63
-4
670
-40
22
2
418
2
2024-25891
136
782
49
65
2
717
47
109
87
39
35
70
52
Average9559338784622616
Baptist Health Sciences University Enrollment Trends Chart

Undergraduate Enrollment Changes

The average number of Undergraduate students over the last 11 years is 933 where 782 students are attending the Undergraduate school for the academic year 2024-2025. The following table and chart illustrate the changes in Undergraduate enrollment by attending status and gender at Baptist Health Sciences University since 2015.

YearTotalFull-timePart-time
TotalMenWomenTotalMenWomen
2015-161,0794634941461645571
2016-171,0774674342461056554
2017-181,0755096044956643523
2018-191,0564875842956953516
2019-209714205037055152499
2020-218713603732351142469
2021-229103433930456749518
2022-237773033027347437437
2023-247332722724546136425
2024-257823523232043033397
Average9339334335593345491
Baptist Health Sciences University Undergraduate Enrollment Trends Chart

Graduate Enrollment Changes

The average number of Graduate students over the last 11 years is 22 where 109 students are attending the Graduate school for the academic year 2024-2025. The following table and chart illustrate the changes in Graduate enrollment by attending status and gender at Baptist Health Sciences University since 2015.

YearTotalFull-timePart-time
TotalMenWomenTotalMenWomen
2015-160000000
2016-170000000
2017-180000000
2018-198725101
2019-201816214202
2020-21197071239
2021-222551420416
2022-23201129927
2023-242271615312
2024-2510993365716313
Average22224102226
Baptist Health Sciences University Graduate Enrollment Trends Chart

Enrollment by Race/Ethnicity Changes

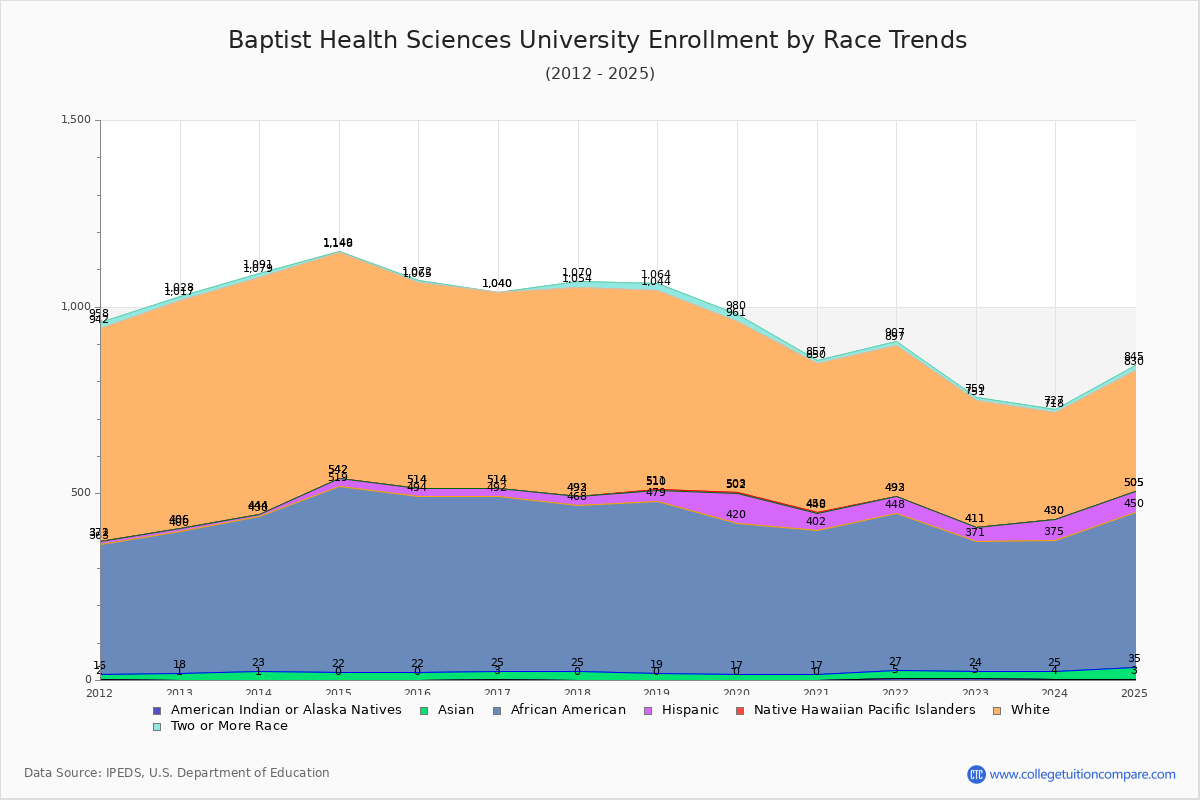
The percentage of white students is 36.48% and the percentage of black students is 46.58% at Baptist Health Sciences University. 3.59% of enrolled students is Asian. Hispanic students comprise 6.17% of the student body.

Over the past 10 years, the racial composition has shifted. The percentage of white students decreased from 51.07% to 36.48%. Asian enrollment grew from 2.04% to 3.59%. Black student enrollment increased from 43.74% to 46.58%. Hispanic student representation expanded from 1.85% to 6.17%.

The overall racial diversity, measured by the Census Bureau Diversity Index, is 0.6446 which indicates that moderately diverse. This increased from 0.5471 a decade ago, suggesting that racial diversity has improved.

The following table and chart illustrate the student population trends by race/ethnicity at Baptist Health Sciences University over the past 11 years (2015-2025).

YearAmerican Indian or Native AmericanAsianBlackHispanicNative Hawaiian or Other Pacific IslanderWhiteTwo or More Races
2015-160224722005517
2016-173224672205260
2017-1802544324156116
2018-1901946031153320
2019-2001740382145819
2020-210173854624007
2021-2252242144140410
2022-235193474003408
2023-244213505502889
2024-2533241555032515
Average22241642143911
Baptist Health Sciences University Enrollment by Race Trends Chart

Distance Learning (Online Courses) Enrollment Changes

100 students are enrolled in online degree programs exclusively for the academic year 2024-2025, which is 11% of total students. The number of online students has increased 354.55% since 2015. The following table and chart illustrate the changes in the online student population by enrolled type at Baptist Health Sciences University from 2015 to 2025.

YearTotal EnrollmentOnline CompletelyEnrolled in Some Online CoursesNot Enrolled in Online Courses
2015-161,07922149908
2016-171,0771289976
2017-181,07536260779
2018-191,06442354668
2019-2098942360587
2020-2189068516342
2021-22935181430324
2022-23797117298382
2023-24755166247342
2024-25891100358433
Average955140271544

Ratings & Review

Share your experiences and thoughts about Baptist Health Sciences University. It will be a great help to applicants and prospective students!