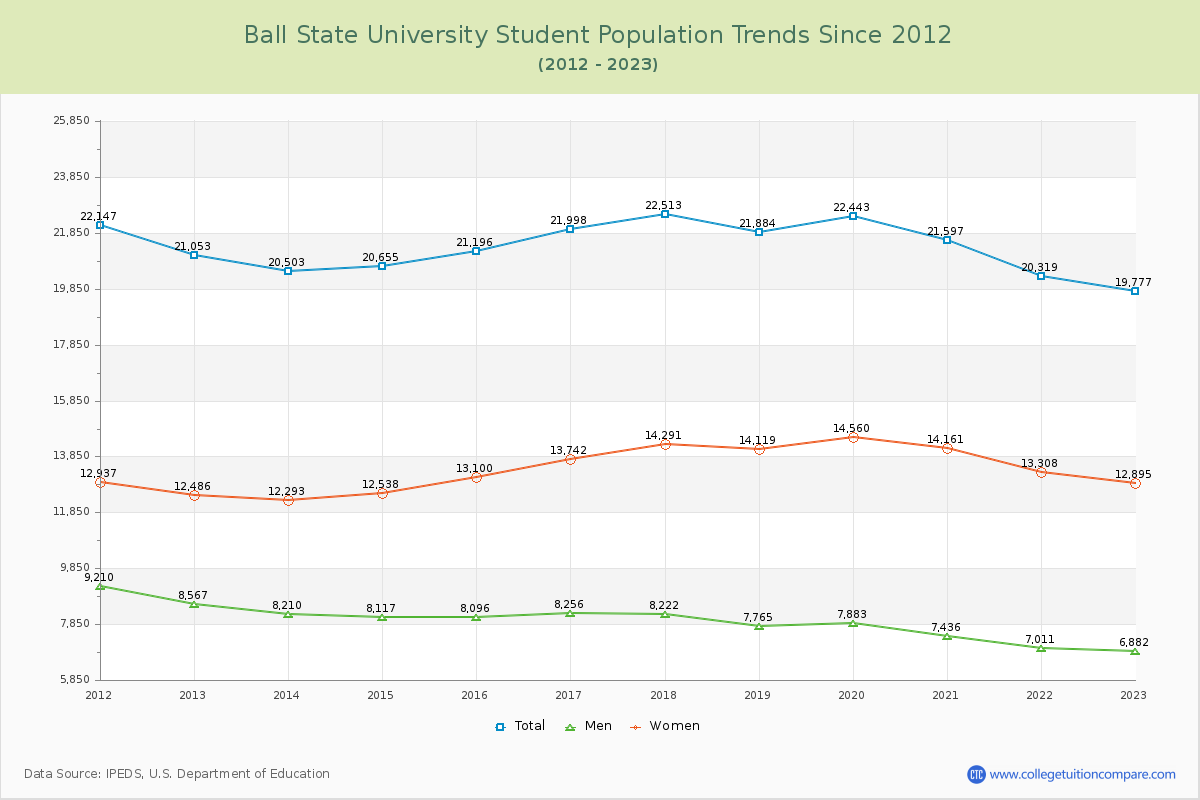
Student Population Changes
The average student population over the last 12 years is 21,267 where 19,777 students are attending the school for the academic year 2022-2023.
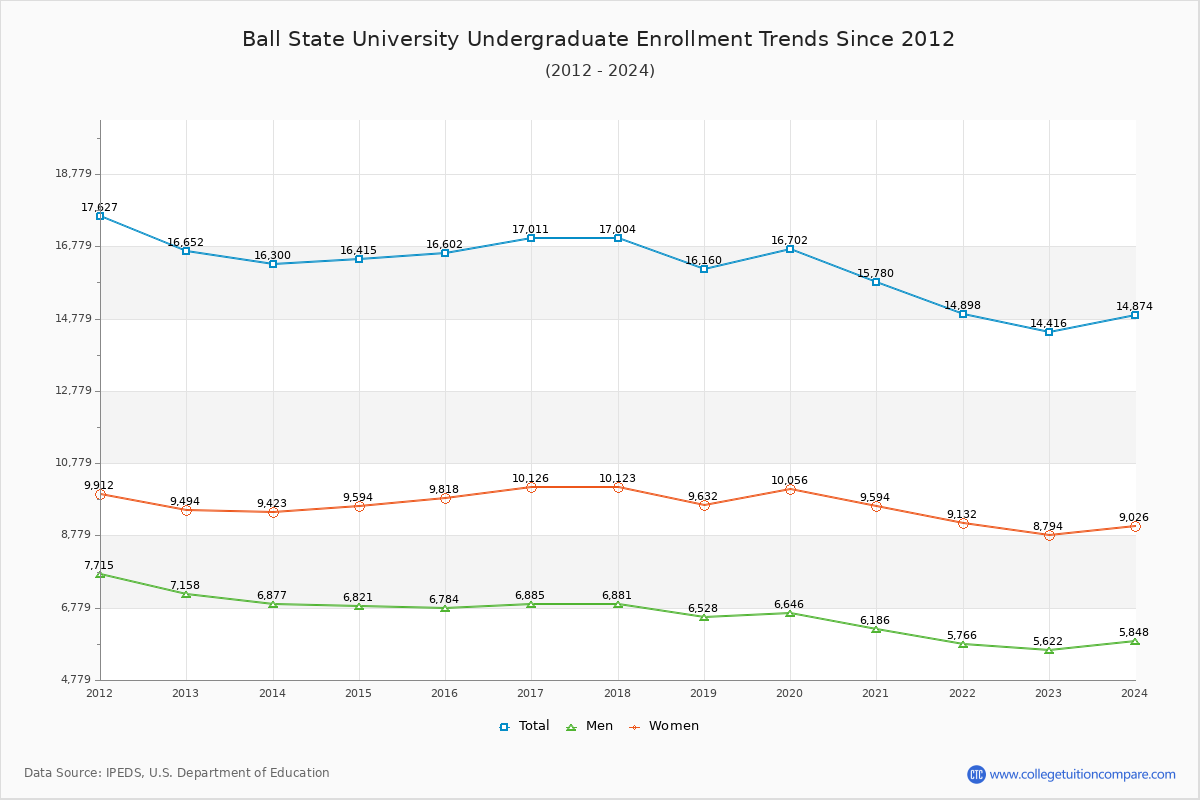
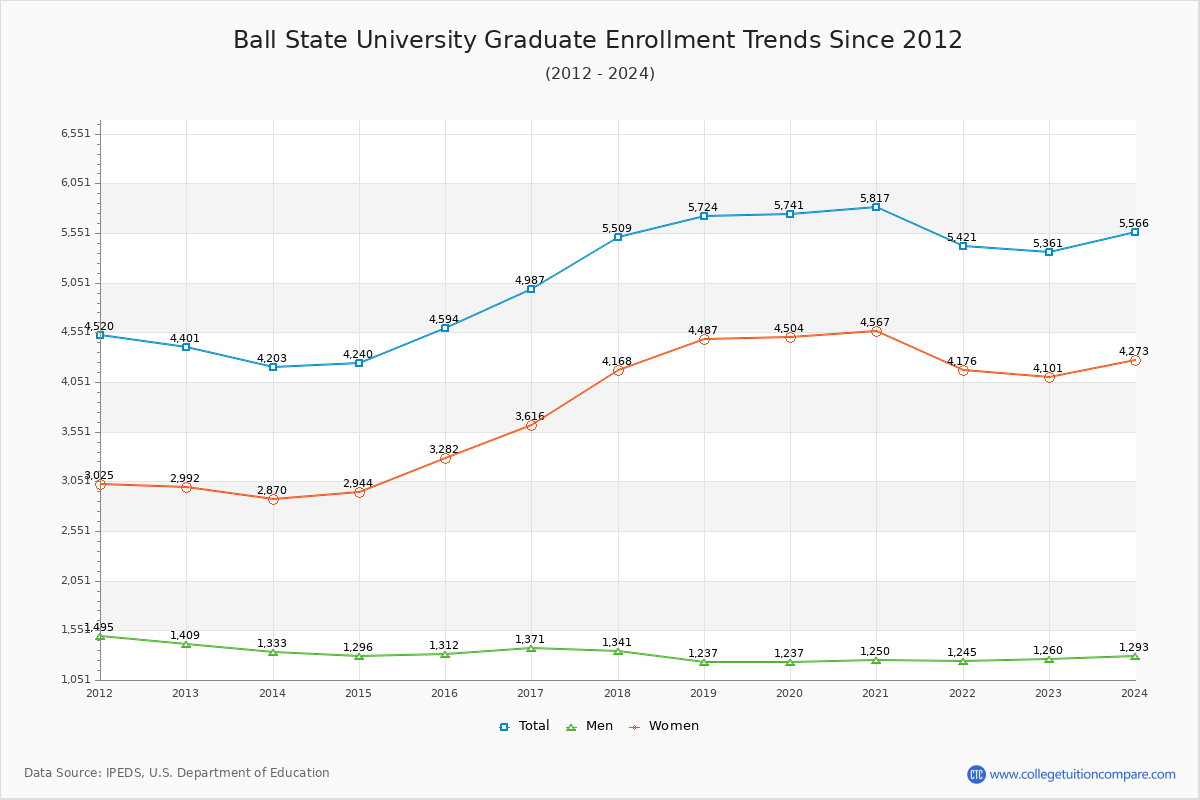
72.89% of total students is undergraduate students and 27.11% students is graduate students. The number of undergraduate students has decreased by 2,236 and the graduate enrollment has increased by 960 over past 10 years.
The female to male ratio is 1.87 to 1 and it means that there are more female students enrolled in BSU than male students.
The following table and chart illustrate the changes in student population by gender at Ball State University since 2012.
| Year | Total | Undergraduate | Graduate | ||||
|---|---|---|---|---|---|---|---|
| Total | Men | Women | Total | Men | Women | ||
| 2012-13 | 21,053 | 16,652 | 7,158 | 9,494 | 4,401 | 1,409 | 2,992 |
| 2013-14 | 20,503 -550 | 16,300 -352 | 6,877 -281 | 9,423 -71 | 4,203 -198 | 1,333 -76 | 2,870 -122 |
| 2014-15 | 20,655 152 | 16,415 115 | 6,821 -56 | 9,594 171 | 4,240 37 | 1,296 -37 | 2,944 74 |
| 2015-16 | 21,196 541 | 16,602 187 | 6,784 -37 | 9,818 224 | 4,594 354 | 1,312 16 | 3,282 338 |
| 2016-17 | 21,998 802 | 17,011 409 | 6,885 101 | 10,126 308 | 4,987 393 | 1,371 59 | 3,616 334 |
| 2017-18 | 22,513 515 | 17,004 -7 | 6,881 -4 | 10,123 -3 | 5,509 522 | 1,341 -30 | 4,168 552 |
| 2018-19 | 21,884 -629 | 16,160 -844 | 6,528 -353 | 9,632 -491 | 5,724 215 | 1,237 -104 | 4,487 319 |
| 2019-20 | 22,443 559 | 16,702 542 | 6,646 118 | 10,056 424 | 5,741 17 | 1,237 0 | 4,504 17 |
| 2020-21 | 21,597 -846 | 15,780 -922 | 6,186 -460 | 9,594 -462 | 5,817 76 | 1,250 13 | 4,567 63 |
| 2021-22 | 20,319 -1,278 | 14,898 -882 | 5,766 -420 | 9,132 -462 | 5,421 -396 | 1,245 -5 | 4,176 -391 |
| 2022-23 | 19,777 -542 | 14,416 -482 | 5,622 -144 | 8,794 -338 | 5,361 -60 | 1,260 15 | 4,101 -75 |
| Average | 21,267 | 16,176 | 6,559 | 9,617 | 5,091 | 1,299 | 3,792 |