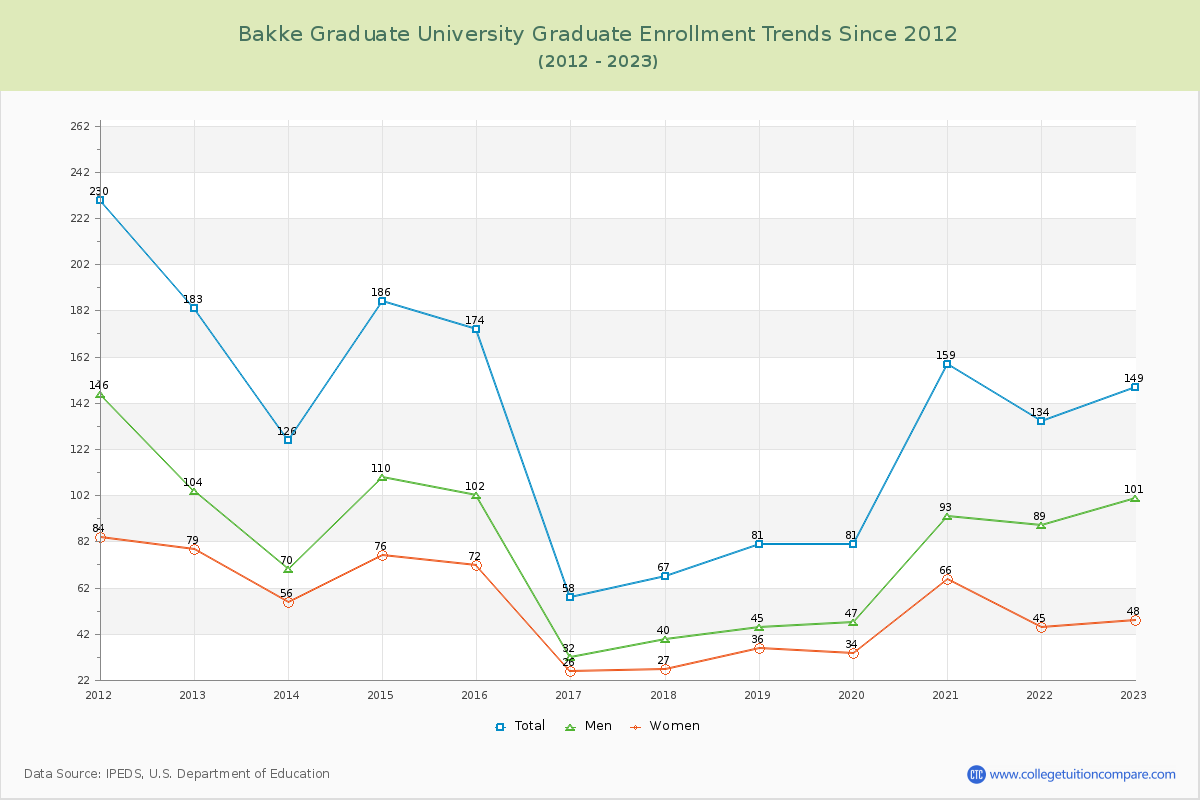
Student Population Changes
The average student population over the last 12 years is 127 where 149 students are attending the school for the academic year 2022-2023.
The female to male ratio is 0.48 to 1 and it means that there are far more male students enrolled in BGU than female students.
The following table and chart illustrate the changes in student population by gender at Bakke Graduate University since 2012.
| Year | Total | Men | Women |
|---|---|---|---|
| 2012-13 | 183 | 104 | 79 |
| 2013-14 | 126 -57 | 70 -34 | 56 -23 |
| 2014-15 | 186 60 | 110 40 | 76 20 |
| 2015-16 | 174 -12 | 102 -8 | 72 -4 |
| 2016-17 | 58 -116 | 32 -70 | 26 -46 |
| 2017-18 | 67 9 | 40 8 | 27 1 |
| 2018-19 | 81 14 | 45 5 | 36 9 |
| 2019-20 | 81 0 | 47 2 | 34 -2 |
| 2020-21 | 159 78 | 93 46 | 66 32 |
| 2021-22 | 134 -25 | 89 -4 | 45 -21 |
| 2022-23 | 149 15 | 101 12 | 48 3 |
| Average | 127 | 76 | 51 |