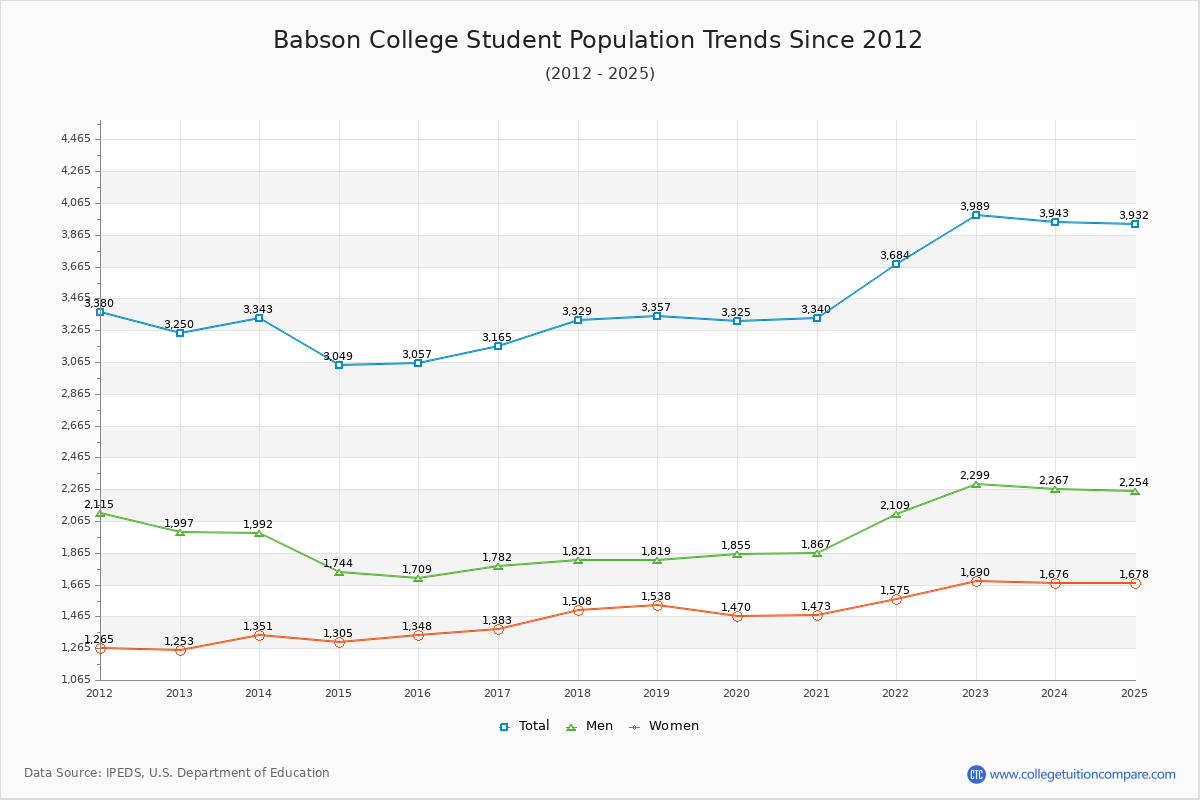
Student Population Changes
The average student population over the last 12 years is 3,353 where 3,989 students are attending the school for the academic year 2022-2023.
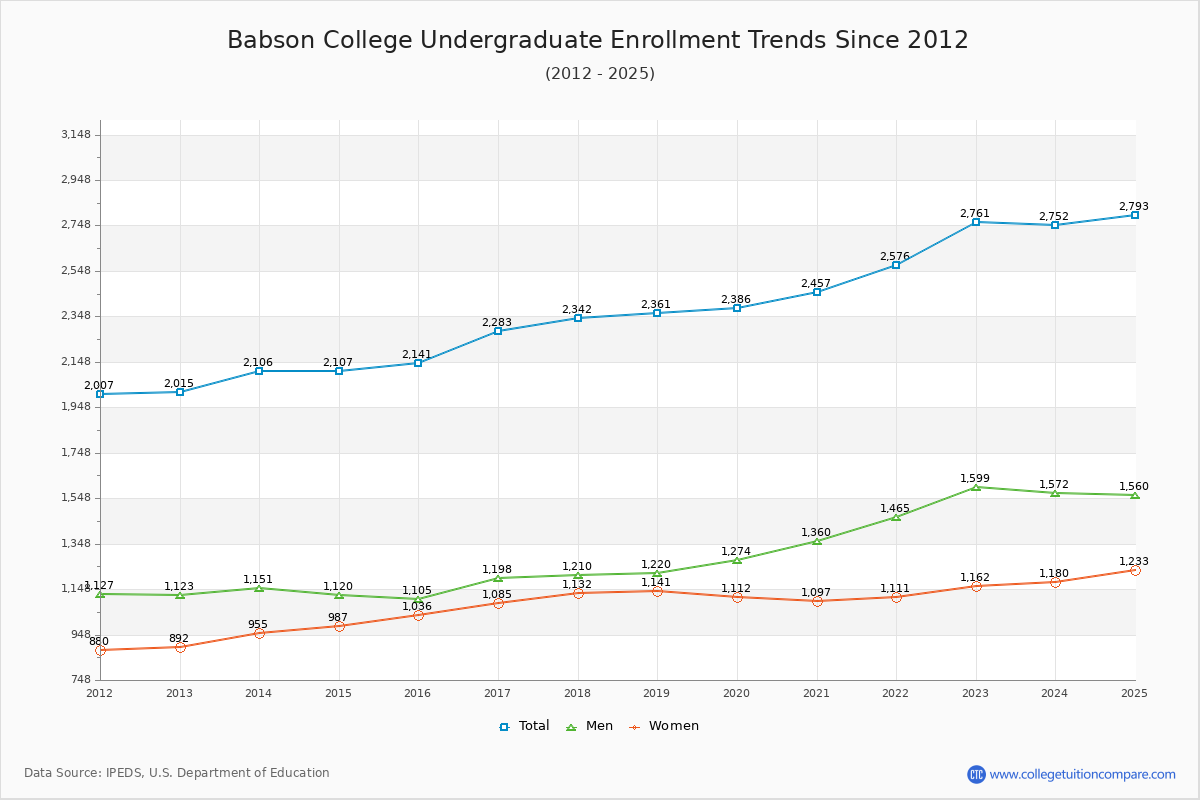
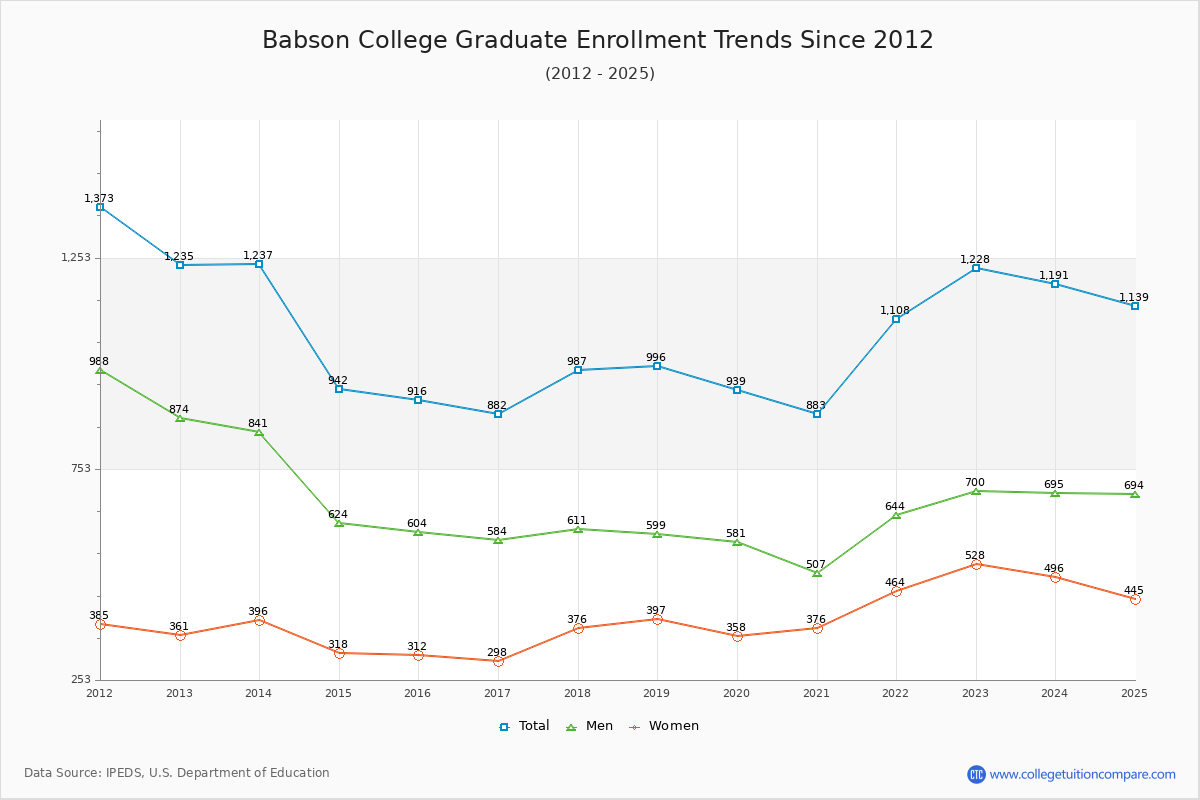
69.22% of total students is undergraduate students and 30.78% students is graduate students. The number of undergraduate students has increased by 746 and the graduate enrollment has decreased by 7 over past 10 years.
The female to male ratio is 0.74 to 1 and it means that there are more male students enrolled in Babson than female students.
The following table and chart illustrate the changes in student population by gender at Babson College since 2012.
| Year | Total | Undergraduate | Graduate | ||||
|---|---|---|---|---|---|---|---|
| Total | Men | Women | Total | Men | Women | ||
| 2012-13 | 3,250 | 2,015 | 1,123 | 892 | 1,235 | 874 | 361 |
| 2013-14 | 3,343 93 | 2,106 91 | 1,151 28 | 955 63 | 1,237 2 | 841 -33 | 396 35 |
| 2014-15 | 3,049 -294 | 2,107 1 | 1,120 -31 | 987 32 | 942 -295 | 624 -217 | 318 -78 |
| 2015-16 | 3,057 8 | 2,141 34 | 1,105 -15 | 1,036 49 | 916 -26 | 604 -20 | 312 -6 |
| 2016-17 | 3,165 108 | 2,283 142 | 1,198 93 | 1,085 49 | 882 -34 | 584 -20 | 298 -14 |
| 2017-18 | 3,329 164 | 2,342 59 | 1,210 12 | 1,132 47 | 987 105 | 611 27 | 376 78 |
| 2018-19 | 3,357 28 | 2,361 19 | 1,220 10 | 1,141 9 | 996 9 | 599 -12 | 397 21 |
| 2019-20 | 3,325 -32 | 2,386 25 | 1,274 54 | 1,112 -29 | 939 -57 | 581 -18 | 358 -39 |
| 2020-21 | 3,340 15 | 2,457 71 | 1,360 86 | 1,097 -15 | 883 -56 | 507 -74 | 376 18 |
| 2021-22 | 3,684 344 | 2,576 119 | 1,465 105 | 1,111 14 | 1,108 225 | 644 137 | 464 88 |
| 2022-23 | 3,989 305 | 2,761 185 | 1,599 134 | 1,162 51 | 1,228 120 | 700 56 | 528 64 |
| Average | 3,353 | 2,321 | 1,257 | 1,065 | 1,032 | 652 | 380 |