Graduation Rate Changes

The average graduation rate of the last 8 years is 15.86% where the current academic year rate is 0%.
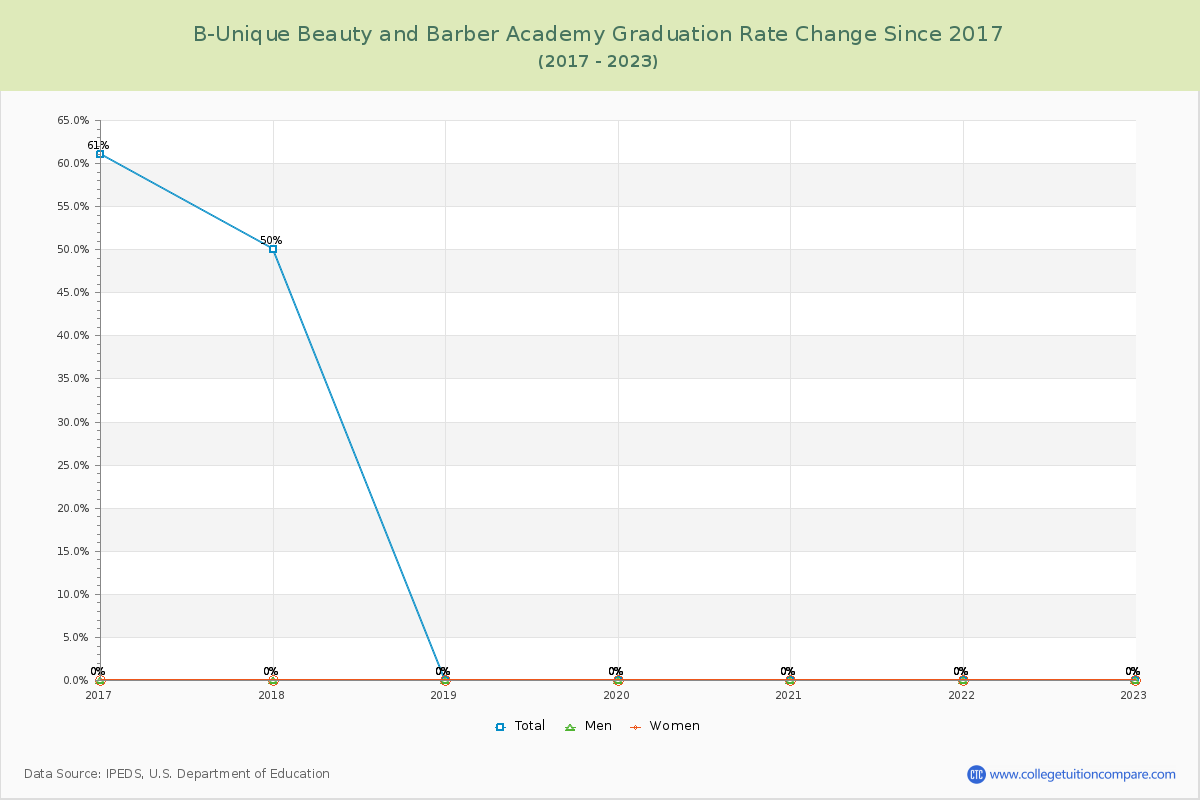
The following table and chart show the changes of graduation rate at B-Unique Beauty and Barber Academy over the past 8 years (2016-2023).
TableInteractive ChartDownloadable Chart
YearTotalMenWomen
2016-17 61%0%0%
2017-18 50%0%0%
2018-19 0%0%0%
2019-20 0%0%0%
2020-21 0%0%0%
2021-22 0%0%0%
2022-23 0%0%0%
Average15.86%0.00%0.00%
Graduation Rate Changes of B-Unique Beauty and Barber Academy
B-Unique Beauty and Barber Academy Graduation Rate Changes Chart

Transfer-out Rate Changes

The average transfer-out rate of the last 8 years is 5.57% where the current year rate is 0%. The following table and chart illustrate the change of transfer-out rate at B-Unique Beauty and Barber Academy from 2016 to 2023.
TableChart
YearTransfer-out Rate
2016-1739%
2017-180%
2018-190%
2019-200%
2020-210%
2021-220%
2022-230%
Average5.57%
Transfer-out Rate Changes of B-Unique Beauty and Barber Academy

Retention Rate Changes

The average retention rate of the last 8 years is 59.29% for full-time students and 53.43% for part-time students.
The following table shows the changes of retention rate at BUBBA from 2016 to 2023.
TableChart
YearFull-timePart-time
2016-17--
2017-1882%100%
2018-1967%35%
2019-2070%36%
2020-2129%47%
2021-2267%56%
2022-23100%100%
Average59.29%53.43%
Retention Rate Changes of B-Unique Beauty and Barber Academy

Student to Faculty Ratio Changes

The average student to faculty ratio over the last 8 years is 10.57 to 1 where the current academic year ratio is 7 to 1. The following table and chart illustrate the change of student to faculty ratio at B-Unique Beauty and Barber Academy since 2023.
TableChart
YearStudent to Faculty Ratio
2016-1719:1
2017-1814:1
2018-199:1
2019-209:1
2020-219:1
2021-227:1
2022-237:1
Average10.57:1
Student to Faculty Ratio Changes of B-Unique Beauty and Barber Academy
Related Articles and Ads