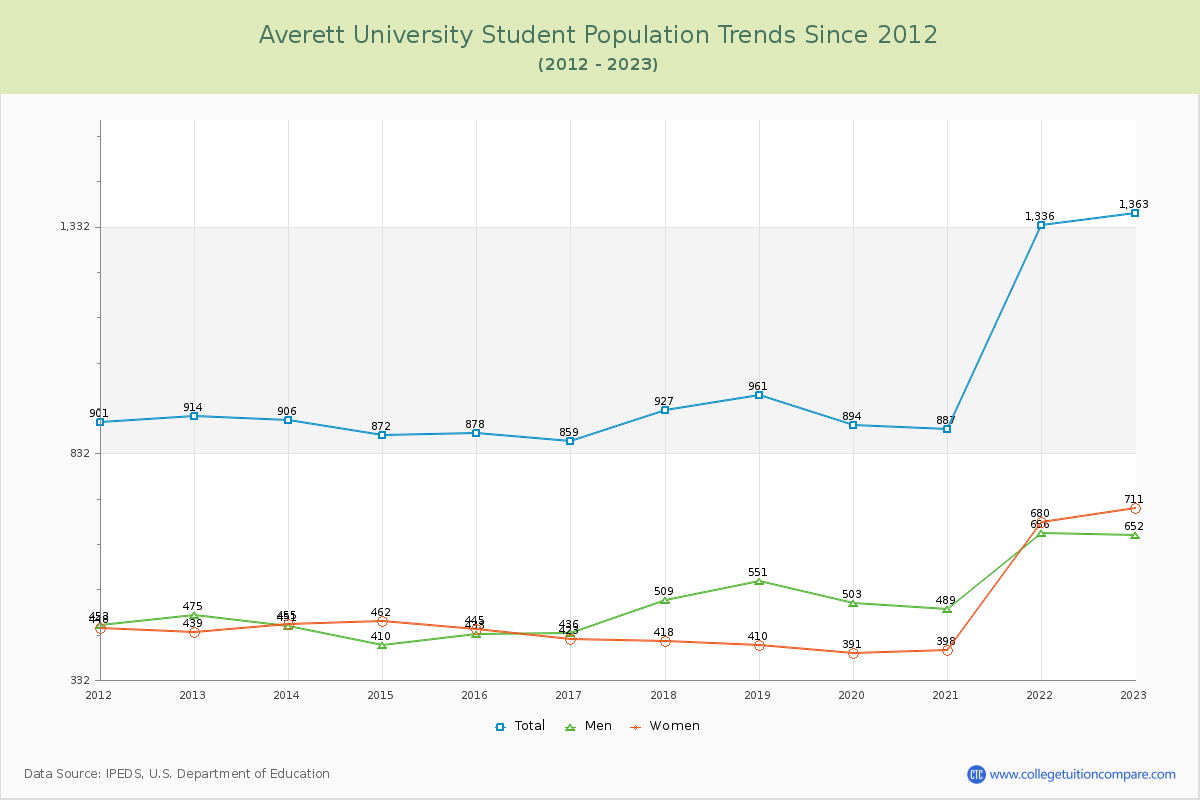
Student Population Changes
The average student population over the last 12 years is 982 where 1,363 students are attending the school for the academic year 2022-2023.
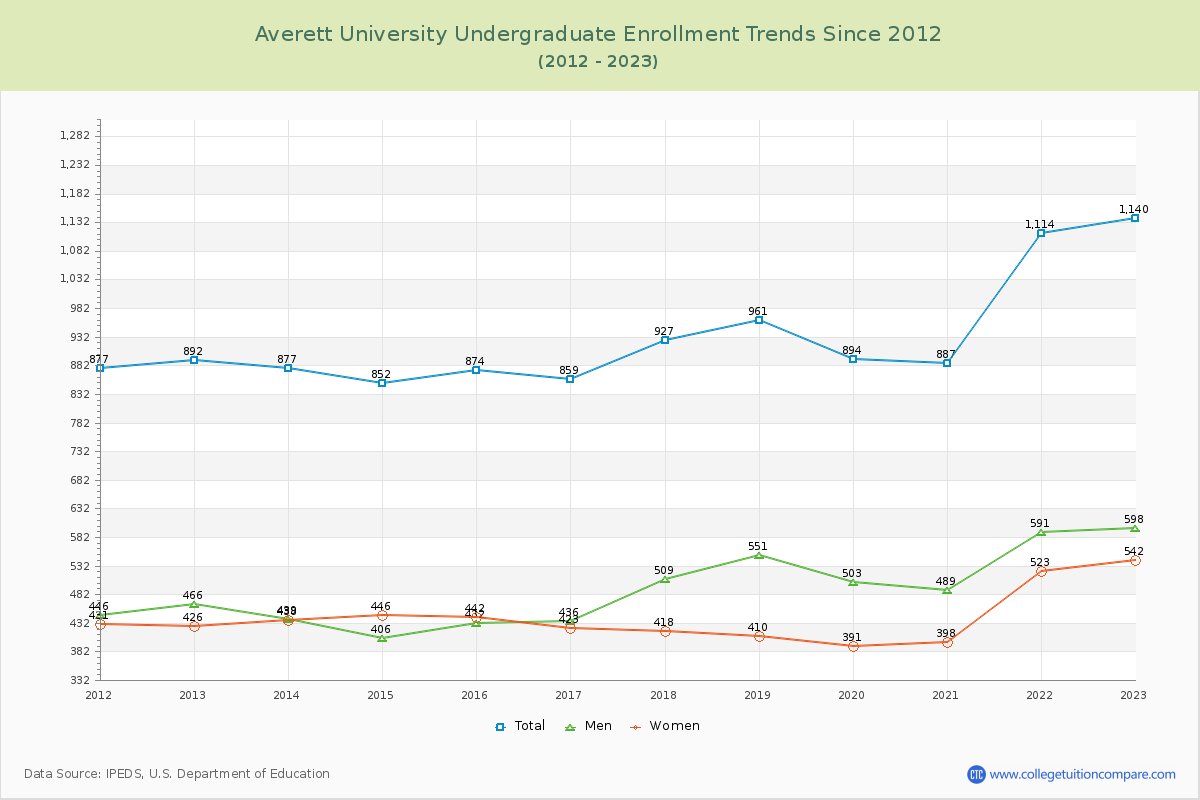
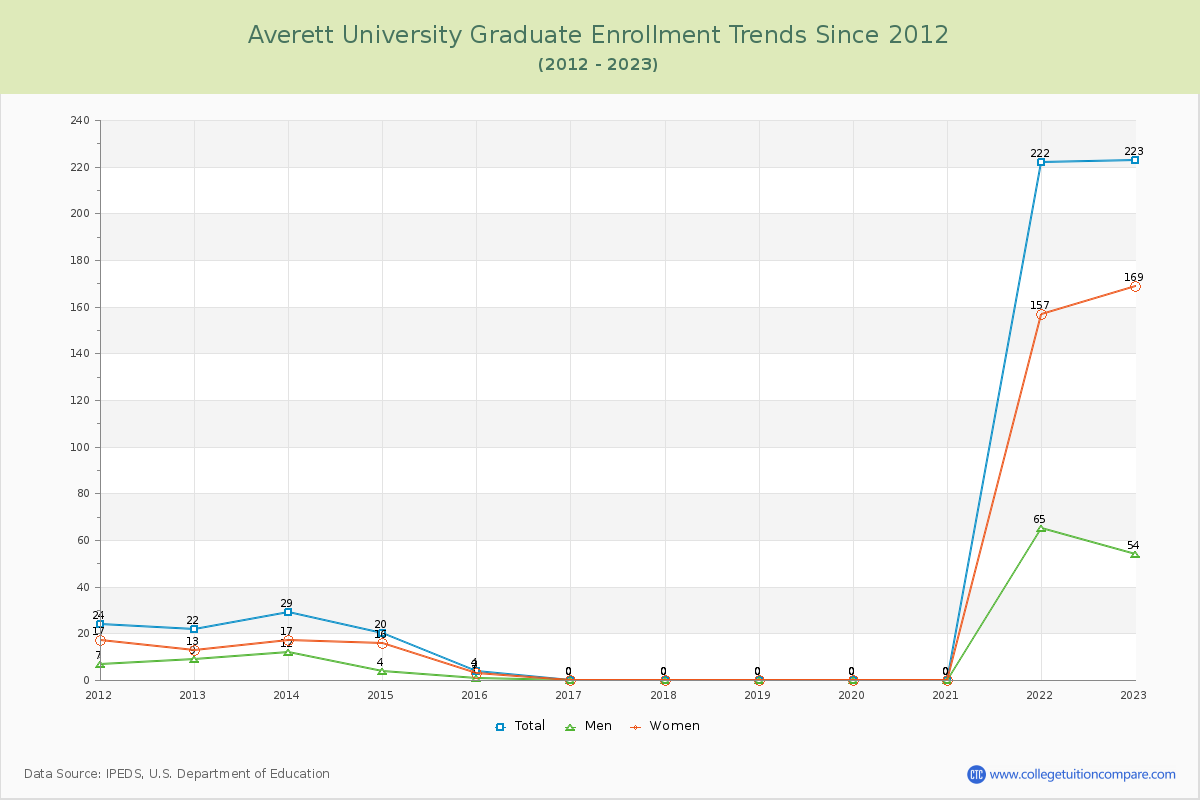
83.64% of total students is undergraduate students and 16.36% students is graduate students. The number of undergraduate students has increased by 248 and the graduate enrollment has increased by 201 over past 10 years.
The female to male ratio is 1.09 to 1 and it means that there are similar numbers of female and male students enrolled in AU.
The following table and chart illustrate the changes in student population by gender at Averett University since 2012.
| Year | Total | Undergraduate | Graduate | ||||
|---|---|---|---|---|---|---|---|
| Total | Men | Women | Total | Men | Women | ||
| 2012-13 | 914 | 892 | 466 | 426 | 22 | 9 | 13 |
| 2013-14 | 906 -8 | 877 -15 | 439 -27 | 438 12 | 29 7 | 12 3 | 17 4 |
| 2014-15 | 872 -34 | 852 -25 | 406 -33 | 446 8 | 20 -9 | 4 -8 | 16 -1 |
| 2015-16 | 878 6 | 874 22 | 432 26 | 442 -4 | 4 -16 | 1 -3 | 3 -13 |
| 2016-17 | 859 -19 | 859 -15 | 436 4 | 423 -19 | 0 -4 | 0 -1 | 0 -3 |
| 2017-18 | 927 68 | 927 68 | 509 73 | 418 -5 | 0 0 | 0 0 | 0 0 |
| 2018-19 | 961 34 | 961 34 | 551 42 | 410 -8 | 0 0 | 0 0 | 0 0 |
| 2019-20 | 894 -67 | 894 -67 | 503 -48 | 391 -19 | 0 0 | 0 0 | 0 0 |
| 2020-21 | 887 -7 | 887 -7 | 489 -14 | 398 7 | 0 0 | 0 0 | 0 0 |
| 2021-22 | 1,336 449 | 1,114 227 | 591 102 | 523 125 | 222 222 | 65 65 | 157 157 |
| 2022-23 | 1,363 27 | 1,140 26 | 598 7 | 542 19 | 223 1 | 54 -11 | 169 12 |
| Average | 982 | 934 | 493 | 442 | 47 | 13 | 34 |