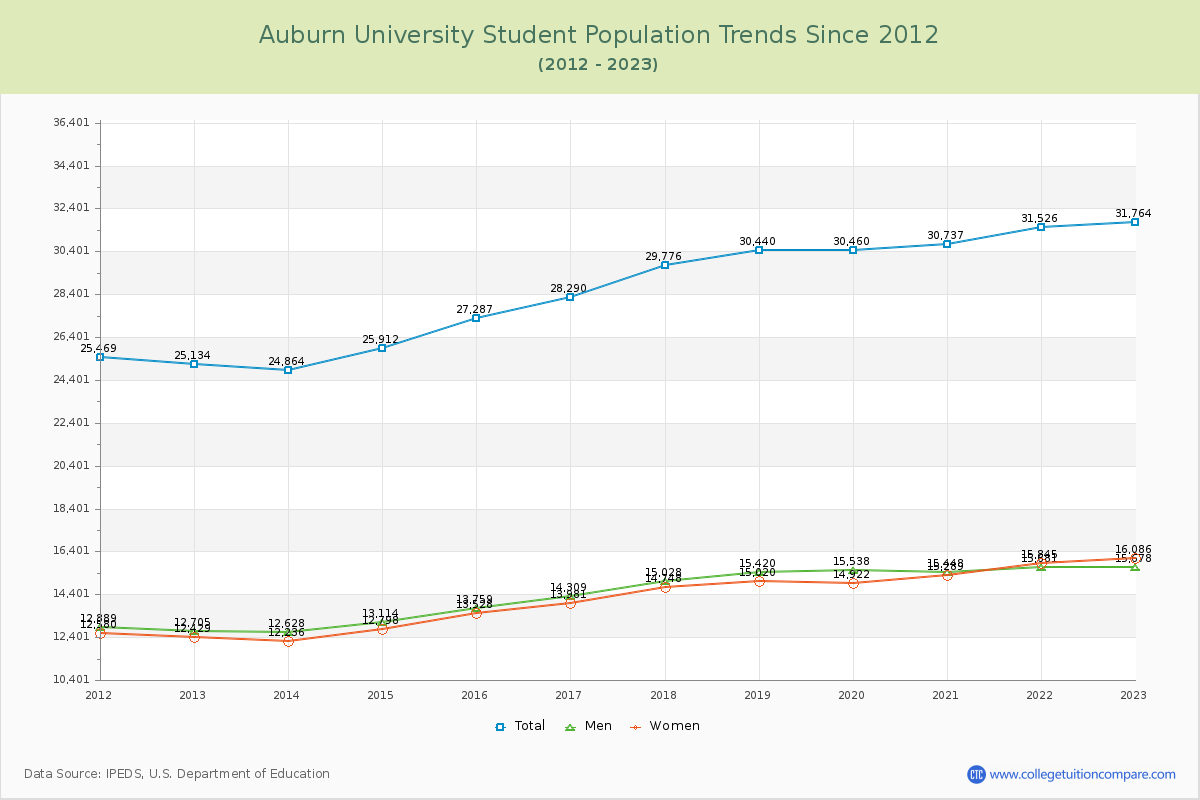
Student Population Changes
The average student population over the last 12 years is 28,745 where 31,764 students are attending the school for the academic year 2022-2023.
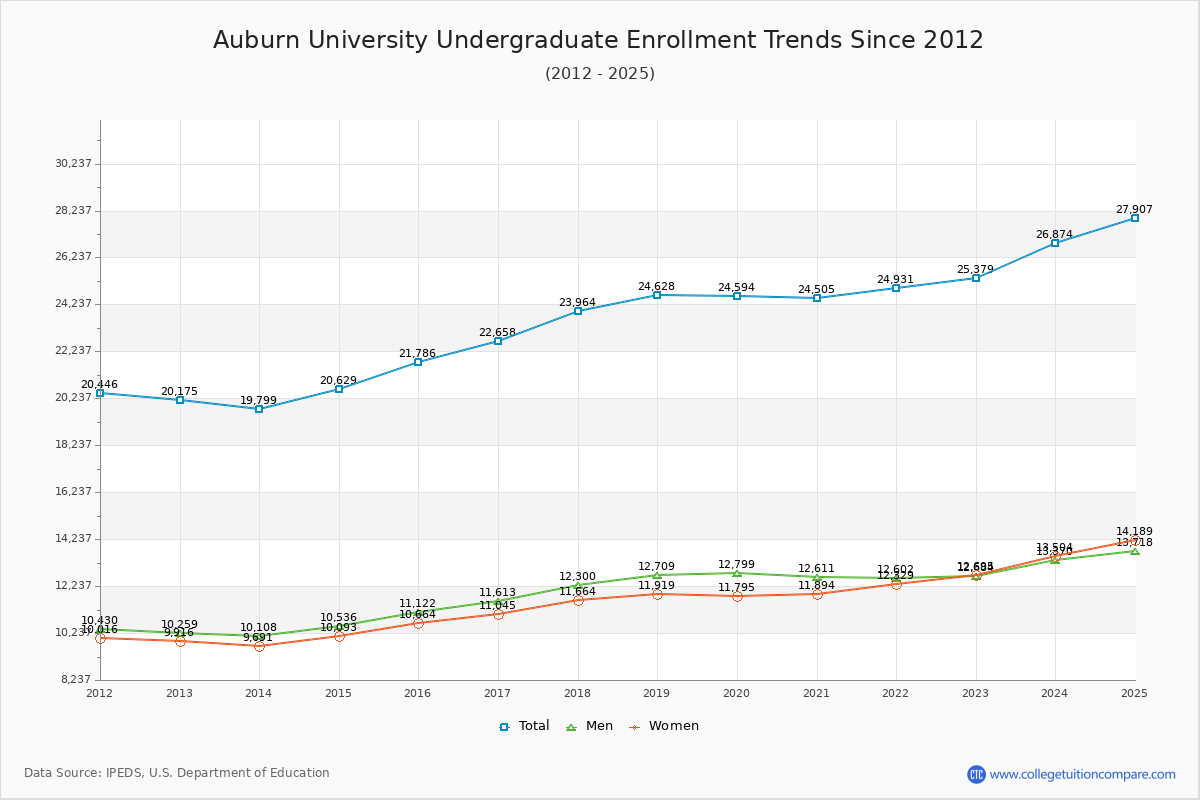
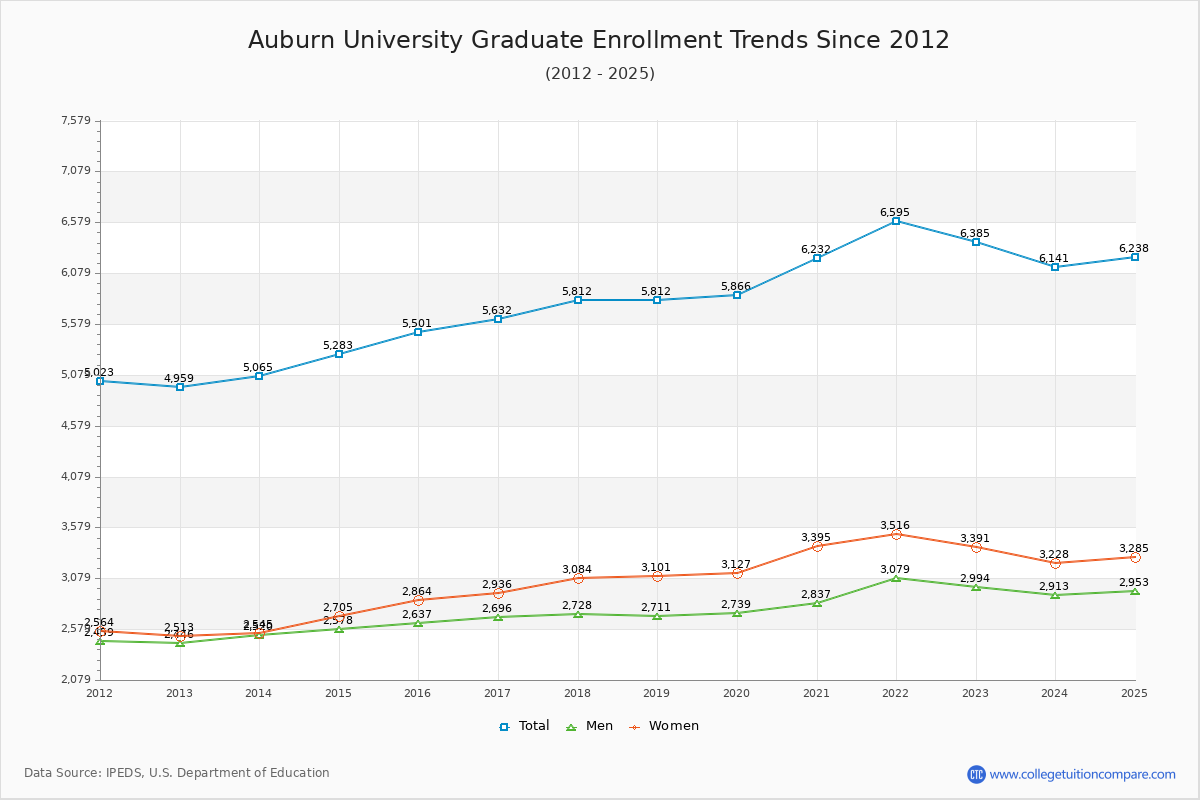
79.90% of total students is undergraduate students and 20.10% students is graduate students. The number of undergraduate students has increased by 5,204 and the graduate enrollment has increased by 1,426 over past 10 years.
The female to male ratio is 1.03 to 1 and it means that there are similar numbers of female and male students enrolled in Auburn.
The following table and chart illustrate the changes in student population by gender at Auburn University since 2012.
| Year | Total | Undergraduate | Graduate | ||||
|---|---|---|---|---|---|---|---|
| Total | Men | Women | Total | Men | Women | ||
| 2012-13 | 25,134 | 20,175 | 10,259 | 9,916 | 4,959 | 2,446 | 2,513 |
| 2013-14 | 24,864 -270 | 19,799 -376 | 10,108 -151 | 9,691 -225 | 5,065 106 | 2,520 74 | 2,545 32 |
| 2014-15 | 25,912 1,048 | 20,629 830 | 10,536 428 | 10,093 402 | 5,283 218 | 2,578 58 | 2,705 160 |
| 2015-16 | 27,287 1,375 | 21,786 1,157 | 11,122 586 | 10,664 571 | 5,501 218 | 2,637 59 | 2,864 159 |
| 2016-17 | 28,290 1,003 | 22,658 872 | 11,613 491 | 11,045 381 | 5,632 131 | 2,696 59 | 2,936 72 |
| 2017-18 | 29,776 1,486 | 23,964 1,306 | 12,300 687 | 11,664 619 | 5,812 180 | 2,728 32 | 3,084 148 |
| 2018-19 | 30,440 664 | 24,628 664 | 12,709 409 | 11,919 255 | 5,812 0 | 2,711 -17 | 3,101 17 |
| 2019-20 | 30,460 20 | 24,594 -34 | 12,799 90 | 11,795 -124 | 5,866 54 | 2,739 28 | 3,127 26 |
| 2020-21 | 30,737 277 | 24,505 -89 | 12,611 -188 | 11,894 99 | 6,232 366 | 2,837 98 | 3,395 268 |
| 2021-22 | 31,526 789 | 24,931 426 | 12,602 -9 | 12,329 435 | 6,595 363 | 3,079 242 | 3,516 121 |
| 2022-23 | 31,764 238 | 25,379 448 | 12,684 82 | 12,695 366 | 6,385 -210 | 2,994 -85 | 3,391 -125 |
| Average | 28,745 | 23,004 | 11,758 | 11,246 | 5,740 | 2,724 | 3,016 |