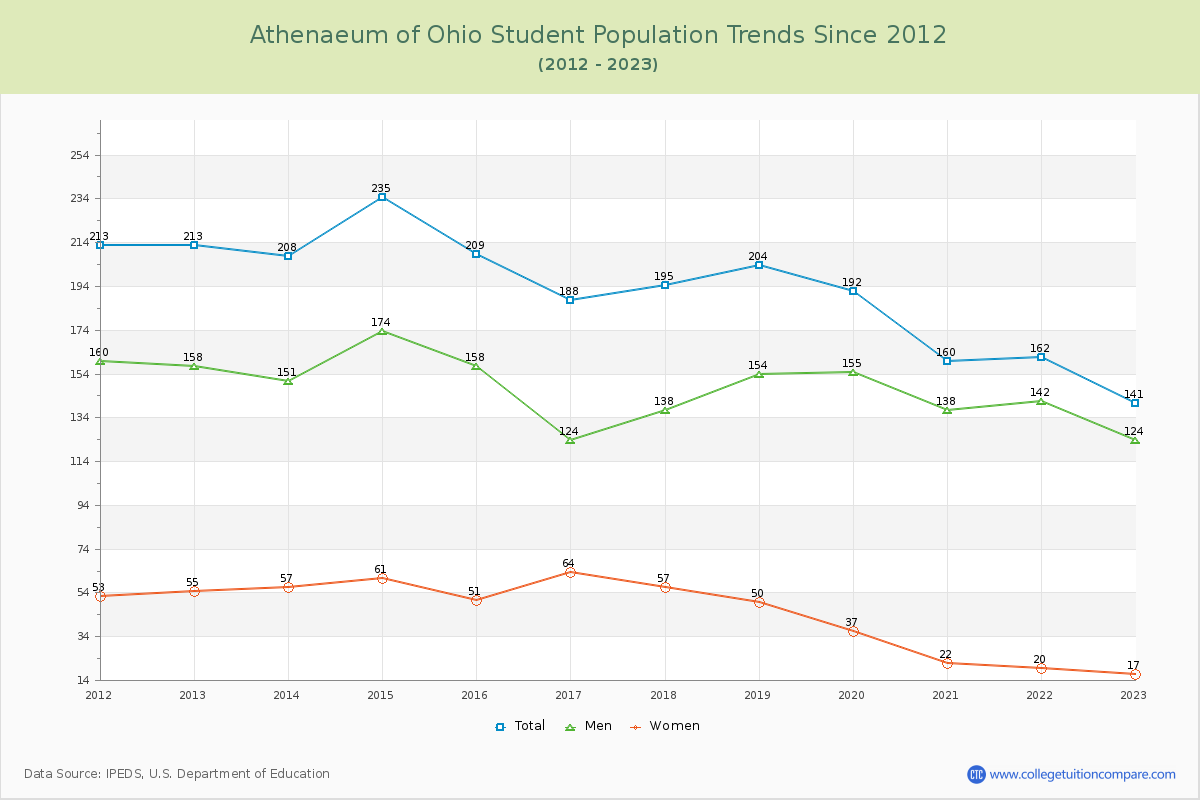
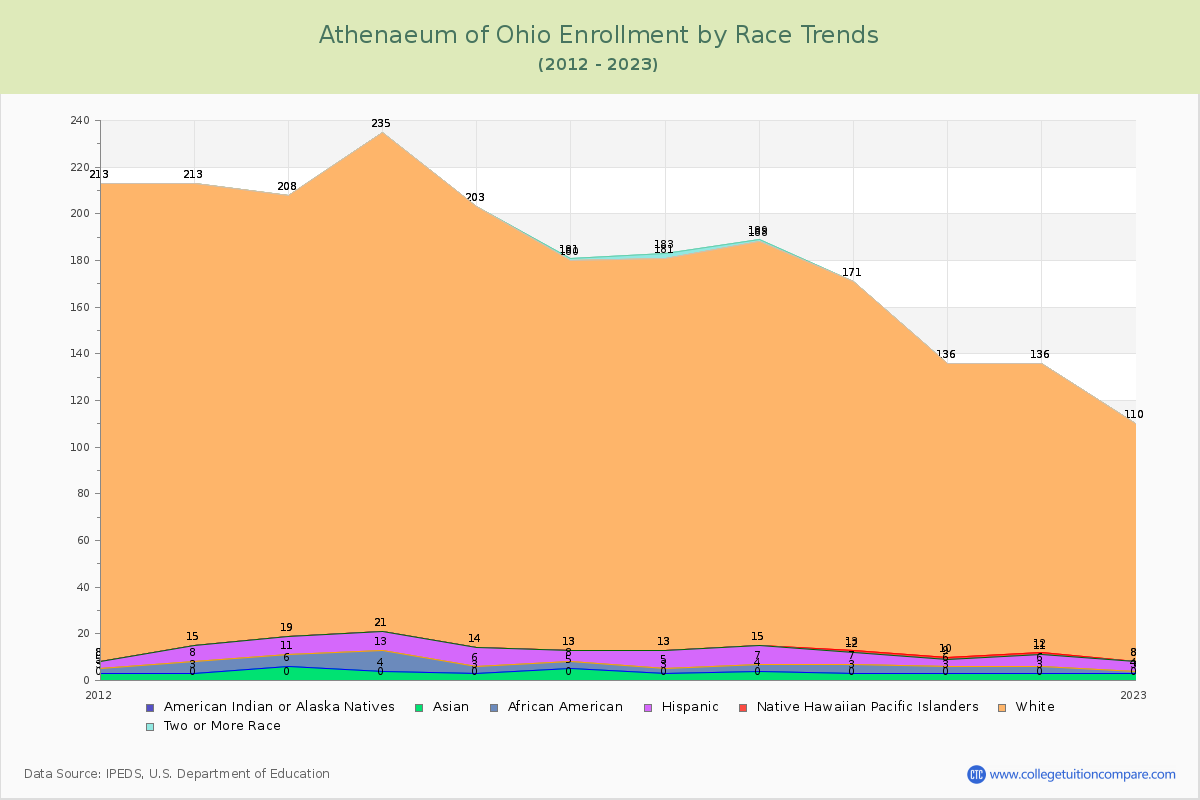
Student Population Changes
The average student population over the last 12 years is 192 where 141 students are attending the school for the academic year 2022-2023.
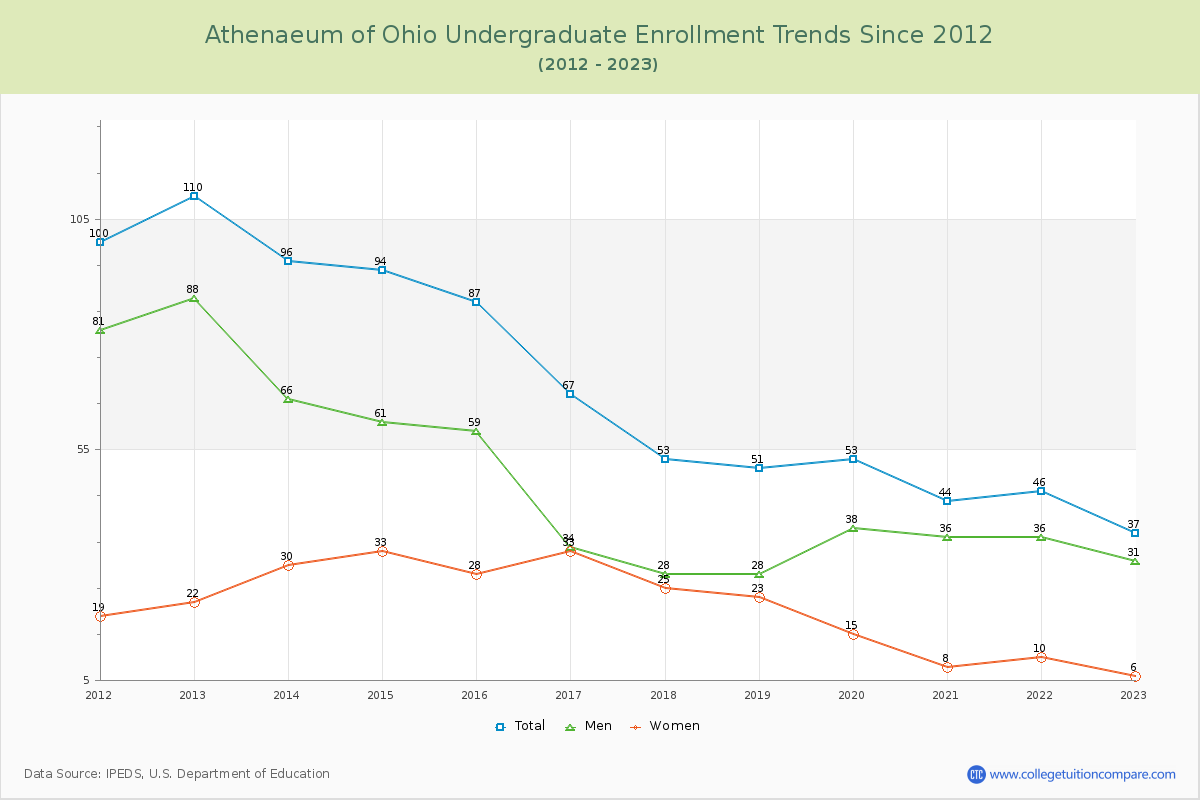
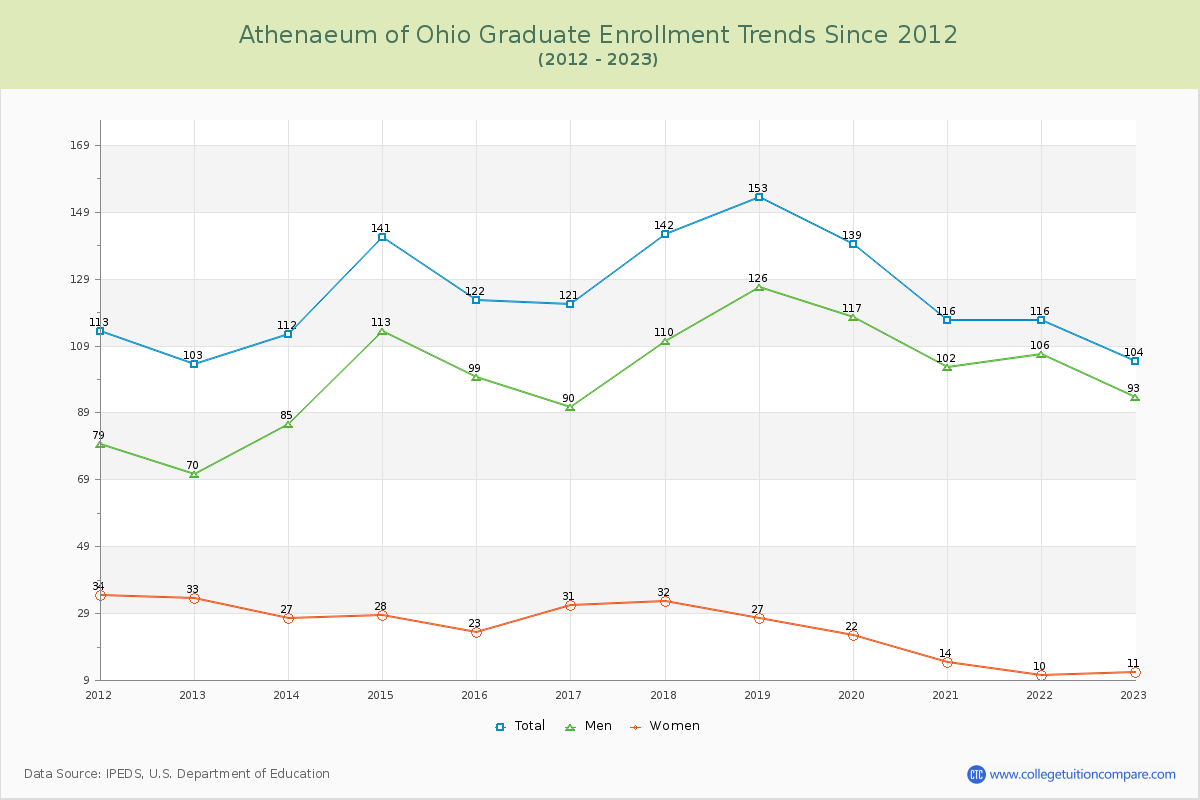
26.24% of total students is undergraduate students and 73.76% students is graduate students. The number of undergraduate students has decreased by 73 and the graduate enrollment has increased by 1 over past 10 years.
The female to male ratio is 0.14 to 1 and it means that there are far more male students enrolled in Athenaeum of Ohio than female students.
The following table and chart illustrate the changes in student population by gender at Athenaeum of Ohio since 2012.
| Year | Total | Undergraduate | Graduate | ||||
|---|---|---|---|---|---|---|---|
| Total | Men | Women | Total | Men | Women | ||
| 2012-13 | 213 | 110 | 88 | 22 | 103 | 70 | 33 |
| 2013-14 | 208 -5 | 96 -14 | 66 -22 | 30 8 | 112 9 | 85 15 | 27 -6 |
| 2014-15 | 235 27 | 94 -2 | 61 -5 | 33 3 | 141 29 | 113 28 | 28 1 |
| 2015-16 | 209 -26 | 87 -7 | 59 -2 | 28 -5 | 122 -19 | 99 -14 | 23 -5 |
| 2016-17 | 188 -21 | 67 -20 | 34 -25 | 33 5 | 121 -1 | 90 -9 | 31 8 |
| 2017-18 | 195 7 | 53 -14 | 28 -6 | 25 -8 | 142 21 | 110 20 | 32 1 |
| 2018-19 | 204 9 | 51 -2 | 28 0 | 23 -2 | 153 11 | 126 16 | 27 -5 |
| 2019-20 | 192 -12 | 53 2 | 38 10 | 15 -8 | 139 -14 | 117 -9 | 22 -5 |
| 2020-21 | 160 -32 | 44 -9 | 36 -2 | 8 -7 | 116 -23 | 102 -15 | 14 -8 |
| 2021-22 | 162 2 | 46 2 | 36 0 | 10 2 | 116 0 | 106 4 | 10 -4 |
| 2022-23 | 141 -21 | 37 -9 | 31 -5 | 6 -4 | 104 -12 | 93 -13 | 11 1 |
| Average | 192 | 67 | 46 | 21 | 124 | 101 | 23 |