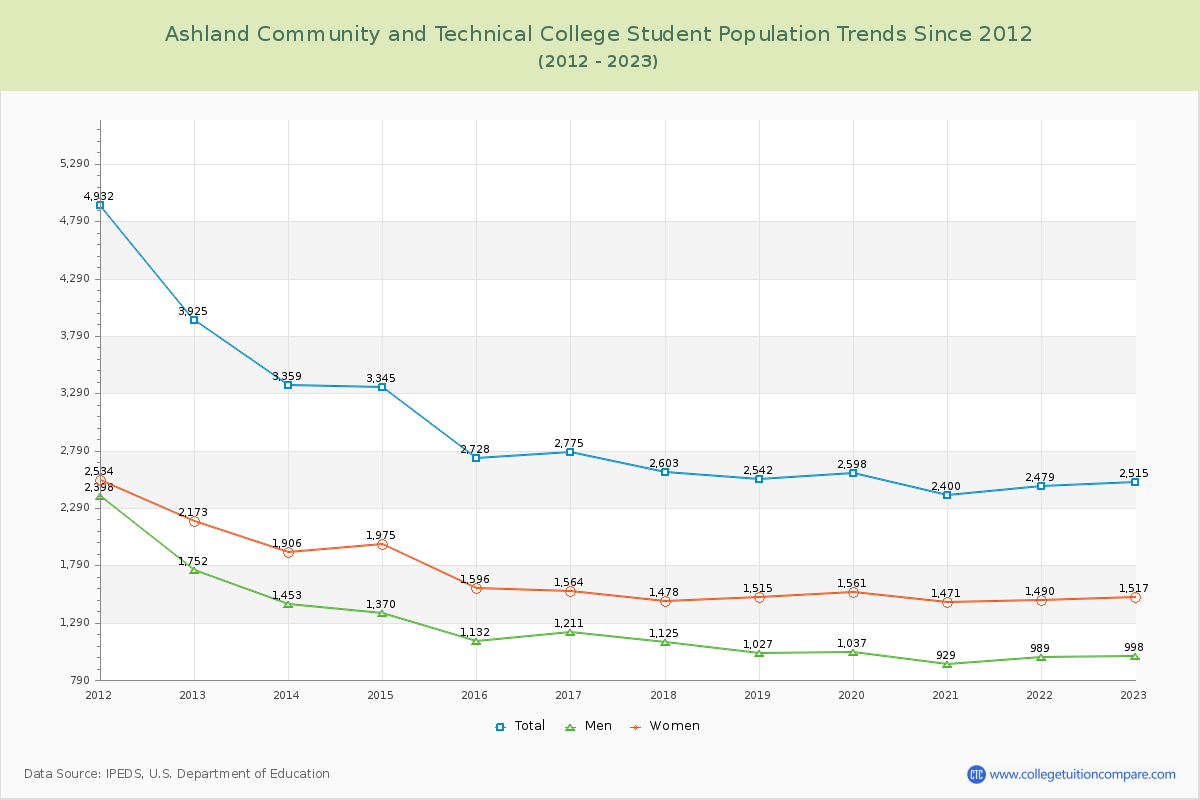
Student Population Changes
The average student population over the last 12 years is 2,843 where 2,515 students are attending the school for the academic year 2022-2023.
The female to male ratio is 1.52 to 1 and it means that there are more female students enrolled in ACTC than male students.
The following table and chart illustrate the changes in student population by gender at Ashland Community and Technical College since 2012.
| Year | Total | Men | Women |
|---|---|---|---|
| 2012-13 | 3,925 | 1,752 | 2,173 |
| 2013-14 | 3,359 -566 | 1,453 -299 | 1,906 -267 |
| 2014-15 | 3,345 -14 | 1,370 -83 | 1,975 69 |
| 2015-16 | 2,728 -617 | 1,132 -238 | 1,596 -379 |
| 2016-17 | 2,775 47 | 1,211 79 | 1,564 -32 |
| 2017-18 | 2,603 -172 | 1,125 -86 | 1,478 -86 |
| 2018-19 | 2,542 -61 | 1,027 -98 | 1,515 37 |
| 2019-20 | 2,598 56 | 1,037 10 | 1,561 46 |
| 2020-21 | 2,400 -198 | 929 -108 | 1,471 -90 |
| 2021-22 | 2,479 79 | 989 60 | 1,490 19 |
| 2022-23 | 2,515 36 | 998 9 | 1,517 27 |
| Average | 2,843 | 1,184 | 1,659 |