Enrollment Trends at Beaver College

-580

Total Enrollment

7

Men

-587

Women

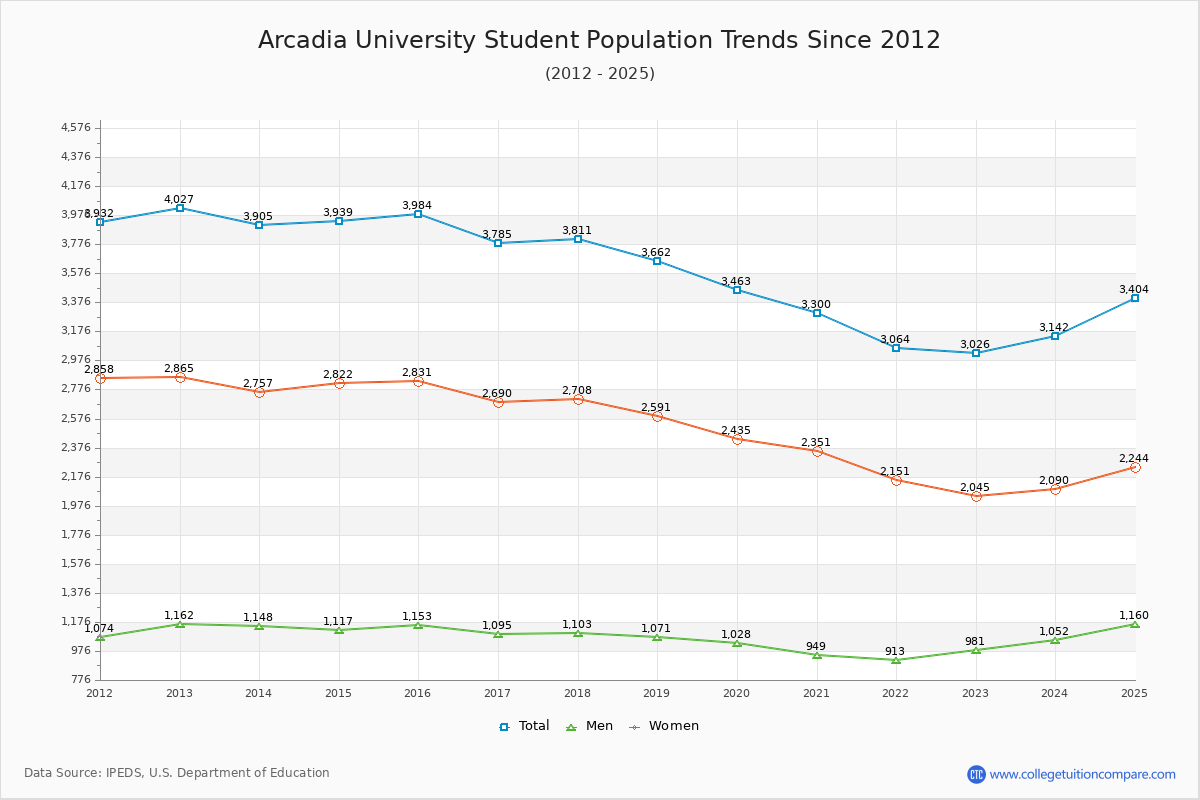
The student population at Arcadia University is 3,404 (2,030 undergraduate and 1,374 graduate students) . The number of students has decreased by 580 over the past decade.

The percentage of undergraduate students at Beaver College is 59.64% which is decreased by 610 over last 10 years. The graduate student population increased by 30 and it has been increasing.

The female to male ratio is 1.93 to 1 which means that female students enrolled more than male students.

618 students enrolled in online degree program exclusively and the number of online students has increased by 192.89% since 2015.

Student Population Changes

The average student population over the last 11 years is 3,464 where 3,404 students are attending the school for the academic year 2024-2025.

59.64% of total students is undergraduate students and 40.36% students is graduate students. The number of undergraduate students has decreased by 610 and the graduate enrollment has increased by 30 over past 10 years.

The female to male ratio is 1.93 to 1 and it means that there are more female students enrolled in Beaver College than male students.

The following table and chart illustrate the changes in student population by gender at Arcadia University since 2015.

YearTotalUndergraduateGraduate
TotalMenWomenTotalMenWomen
2015-163,9842,6408241,8161,3443291,015
2016-173,785
-199
2,473
-167
775
-49
1,698
-118
1,312
-32
320
-9
992
-23
2017-183,811
26
2,390
-83
751
-24
1,639
-59
1,421
109
352
32
1,069
77
2018-193,662
-149
2,160
-230
689
-62
1,471
-168
1,502
81
382
30
1,120
51
2019-203,463
-199
2,149
-11
708
19
1,441
-30
1,314
-188
320
-62
994
-126
2020-213,300
-163
2,014
-135
652
-56
1,362
-79
1,286
-28
297
-23
989
-5
2021-223,064
-236
1,832
-182
621
-31
1,211
-151
1,232
-54
292
-5
940
-49
2022-233,026
-38
1,870
38
671
50
1,199
-12
1,156
-76
310
18
846
-94
2023-243,142
116
1,890
20
691
20
1,1991,252
96
361
51
891
45
2024-253,404
262
2,030
140
748
57
1,282
83
1,374
122
412
51
962
71
Average3,4642,1457131,4321,319338982
Arcadia University Enrollment Trends Chart

Undergraduate Enrollment Changes

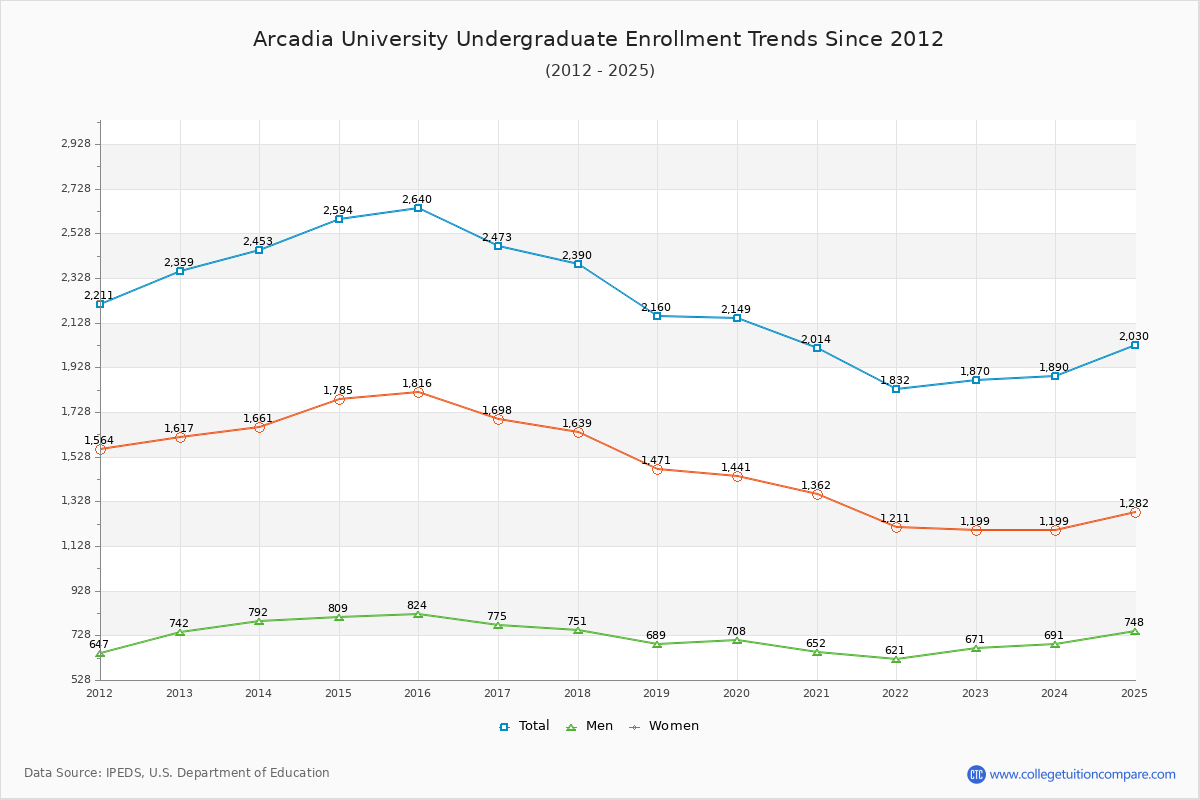
The average number of Undergraduate students over the last 11 years is 2,145 where 2,030 students are attending the Undergraduate school for the academic year 2024-2025. The following table and chart illustrate the changes in Undergraduate enrollment by attending status and gender at Arcadia University since 2015.

YearTotalFull-timePart-time
TotalMenWomenTotalMenWomen
2015-162,6402,3807371,64326087173
2016-172,4732,2666921,57420783124
2017-182,3902,1776781,49921373140
2018-192,1601,9516251,32620964145
2019-202,1491,9296341,29522074146
2020-212,0141,7695871,18224565180
2021-221,8321,6465551,09118666120
2022-231,8701,6285621,066242109133
2023-241,8901,5825661,016308125183
2024-252,0301,8186641,15421284128
Average2,1452,1456301,2852,14583147
Arcadia University Undergraduate Enrollment Trends Chart

Graduate Enrollment Changes

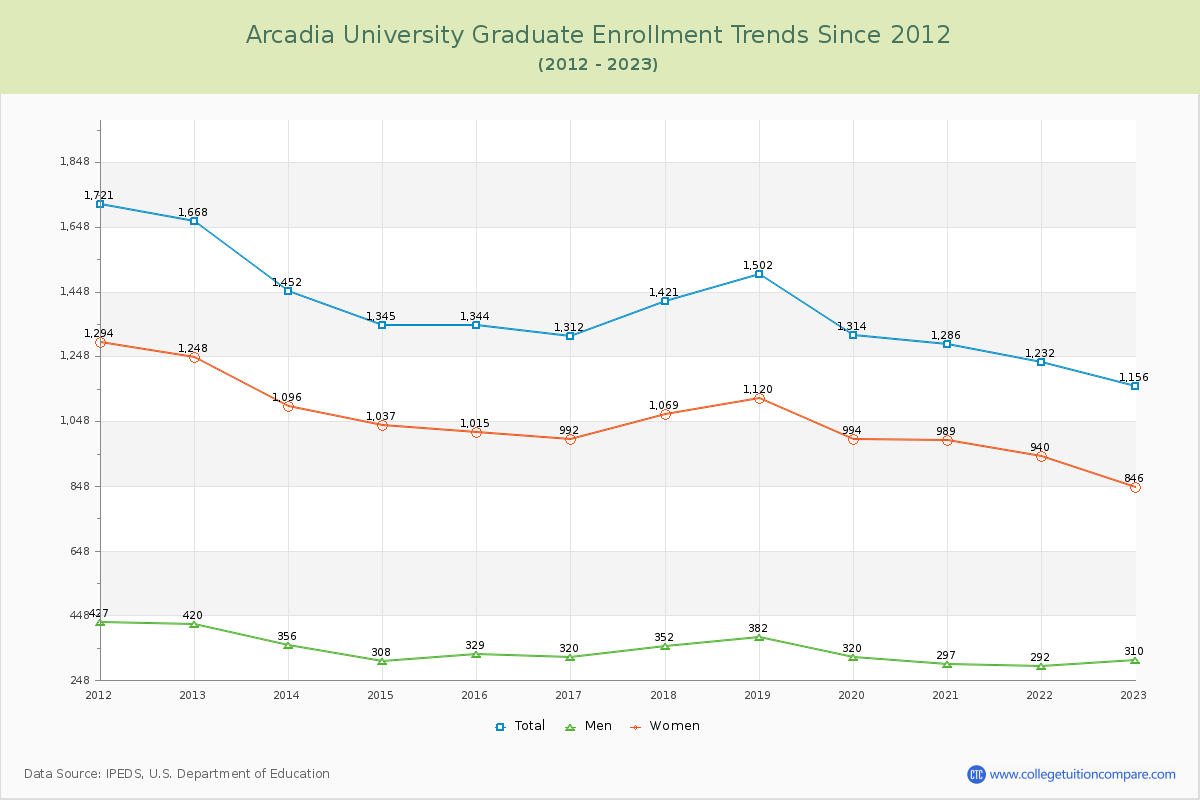
The average number of Graduate students over the last 11 years is 1,319 where 1,374 students are attending the Graduate school for the academic year 2024-2025. The following table and chart illustrate the changes in Graduate enrollment by attending status and gender at Arcadia University since 2015.

YearTotalFull-timePart-time
TotalMenWomenTotalMenWomen
2015-161,344509129380835200635
2016-171,312493123370819197622
2017-181,421519125394902227675
2018-191,502505112393997270727
2019-201,31447997382835223612
2020-211,286476115361810182628
2021-221,232518137381714155559
2022-231,156547151396609159450
2023-241,252561168393691193498
2024-251,374611185426763227536
Average1,3191,3191343881,319203594
Arcadia University Graduate Enrollment Trends Chart

Enrollment by Race/Ethnicity Changes

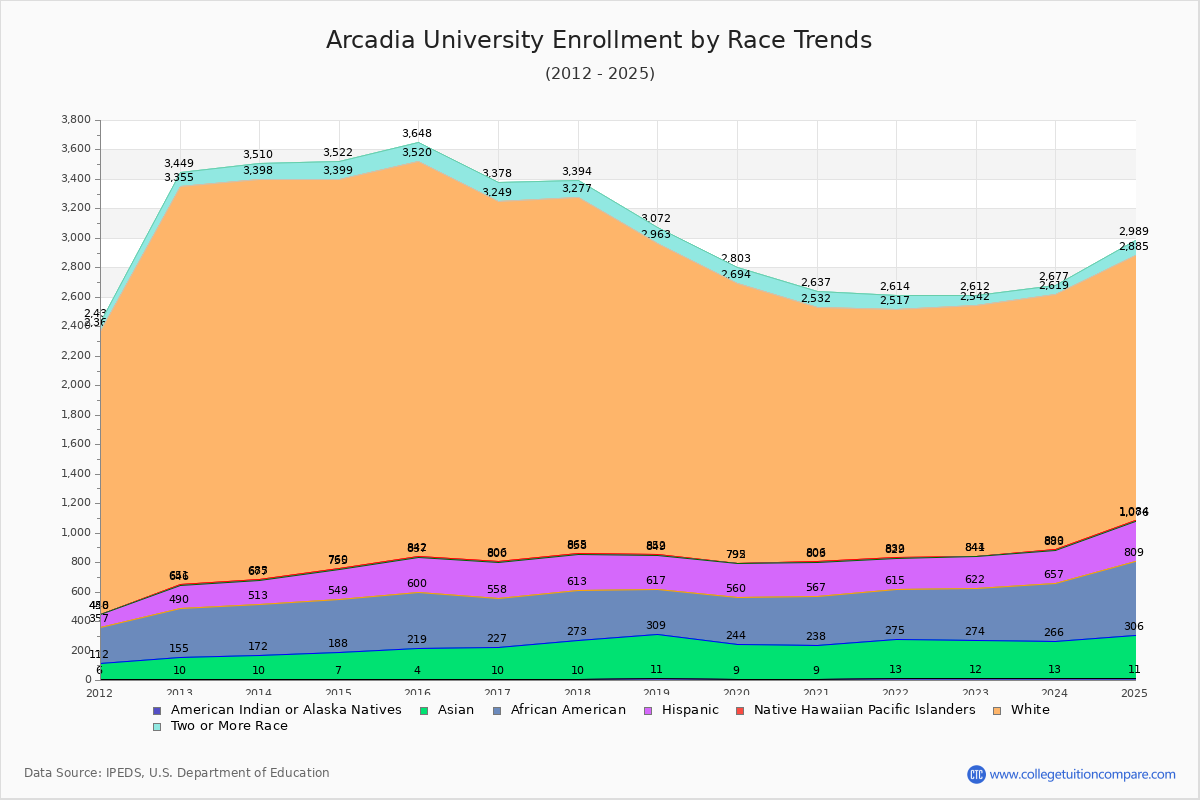
The percentage of white students is 52.91%. The percentage was 67.22% 10 years ago and Beaver College still has a high percentage of white students. 8.67% of enrolled students is Asian and 14.78% is black students. Hispanic students comprise 7.84% of the student body.

Over the past 10 years, the racial composition has shifted. The percentage of white students decreased from 67.22% to 52.91%. Asian enrollment grew from 5.40% to 8.67%. Black student enrollment increased from 9.56% to 14.78%. Hispanic student representation expanded from 5.95% to 7.84%.

The overall racial diversity, measured by the Census Bureau Diversity Index, is 0.6836 which indicates that moderately diverse. This increased from 0.5315 a decade ago, suggesting that racial diversity has improved.

The following table and chart illustrate the student population trends by race/ethnicity at Arcadia University over the past 11 years (2015-2025).

YearAmerican Indian or Native AmericanAsianBlackHispanicNative Hawaiian or Other Pacific IslanderWhiteTwo or More Races
2015-16421538123752,678128
2016-171021733124262,443129
2017-181026334024572,412117
2018-191129830823232,111109
2019-20923531623231,899109
2020-21922932923631,726105
2021-221326234021431,68597
2022-231226234821931,69870
2023-241325339122671,72958
2024-251129550326781,801104
Average1025335923552,018103
Arcadia University Enrollment by Race Trends Chart

Distance Learning (Online Courses) Enrollment Changes

618 students are enrolled in online degree programs exclusively for the academic year 2024-2025, which is 18% of total students. The number of online students has increased 192.89% since 2015. The following table and chart illustrate the changes in the online student population by enrolled type at Arcadia University from 2015 to 2025.

YearTotal EnrollmentOnline CompletelyEnrolled in Some Online CoursesNot Enrolled in Online Courses
2015-163,9842113893,384
2016-173,7853724152,998
2017-183,8113153583,138
2018-193,6626375082,517
2019-203,4635784282,457
2020-213,3002,81765418
2021-223,0647057811,578
2022-233,0265105211,995
2023-243,1424955682,079
2024-253,4046186072,179
Average3,4647264642,274

Ratings & Review

Share your experiences and thoughts about Arcadia University. It will be a great help to applicants and prospective students!