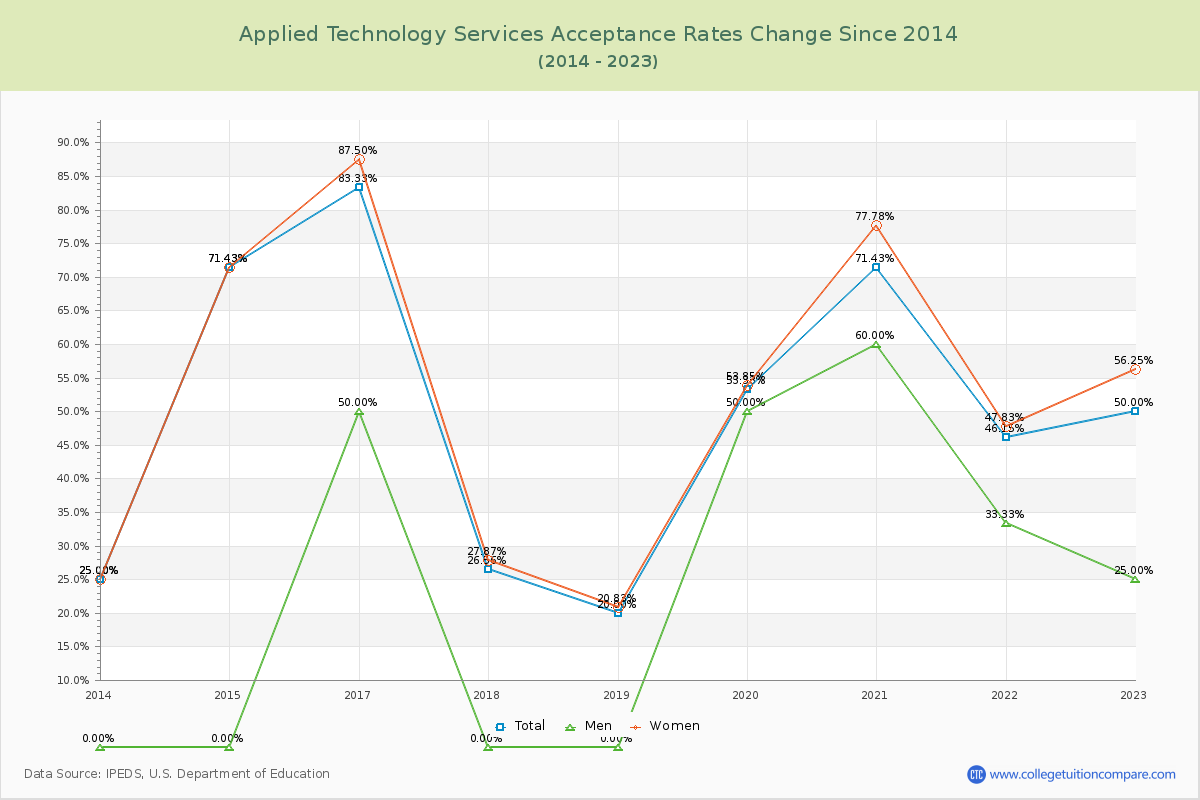
Acceptance Rate Changes
The average acceptance rate over the last 10 years is 44.72%, and this year's acceptance rate is 50.00% at Applied Technology Services. By gender, men students' acceptance rate is 21.83% and women students' rate is 46.83%.
The next table and chart illustrate the acceptance rates changes at Applied Technology Services over the past 10 years (2013-2023).
| Year | Total | Men | Women |
|---|---|---|---|
| 2013-14 | 25.00% | 0.00% | 25.00% |
| 2014-15 | 71.43% 46.43% |
0.00% 46.43% |
71.43% 46.43% |
| 2015-16 | - | - | - |
| 2016-17 | 83.33% - |
50.00% - |
87.50% - |
| 2017-18 | 26.56% -56.77% |
0.00% -59.63% |
27.87% -59.63% |
| 2018-19 | 20.00% -6.56% |
0.00% -7.04% |
20.83% -7.04% |
| 2019-20 | 53.33% 33.33% |
50.00% 33.01% |
53.85% 33.01% |
| 2020-21 | 71.43% 18.10% |
60.00% 23.93% |
77.78% 23.93% |
| 2021-22 | 46.15% -25.27% |
33.33% -29.95% |
47.83% -29.95% |
| 2022-23 | 50.00% 3.85% |
25.00% 8.42% |
56.25% 8.42% |
| Average | 44.72% | 21.83% | 46.83% |