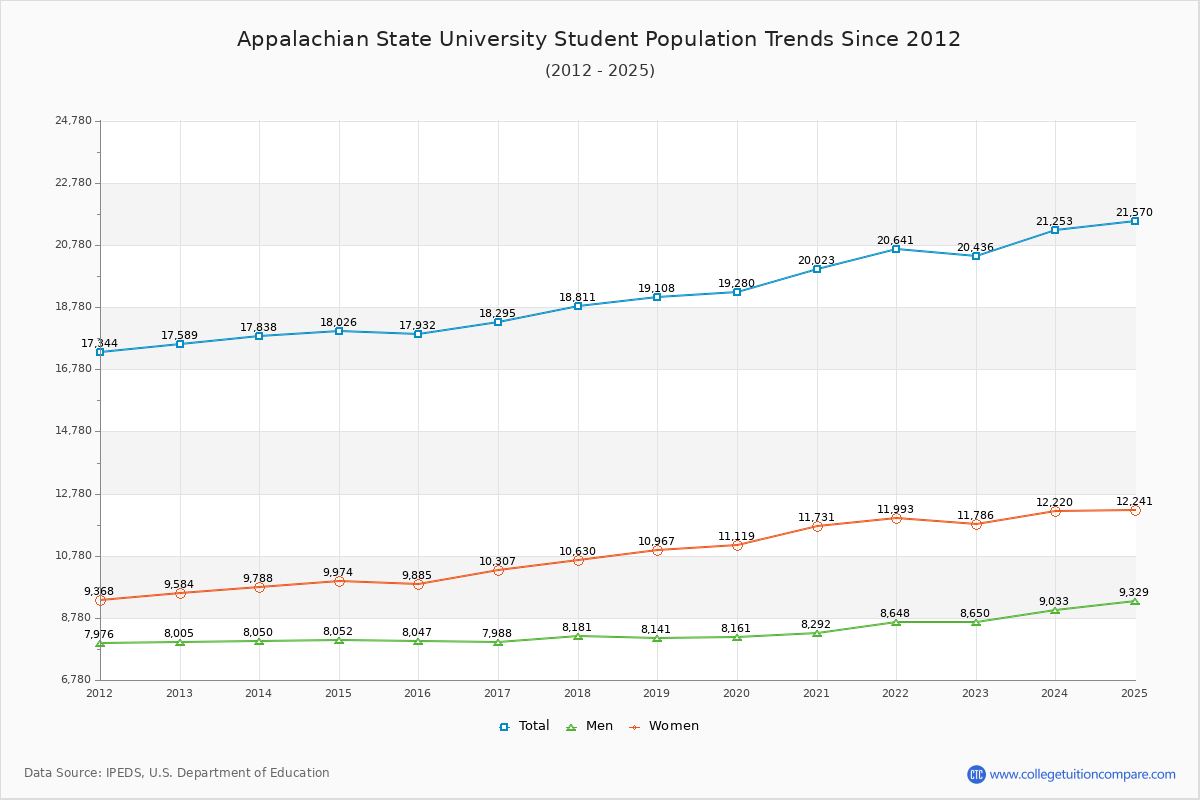
Student Population Changes
The average student population over the last 12 years is 18,907 where 20,436 students are attending the school for the academic year 2022-2023.
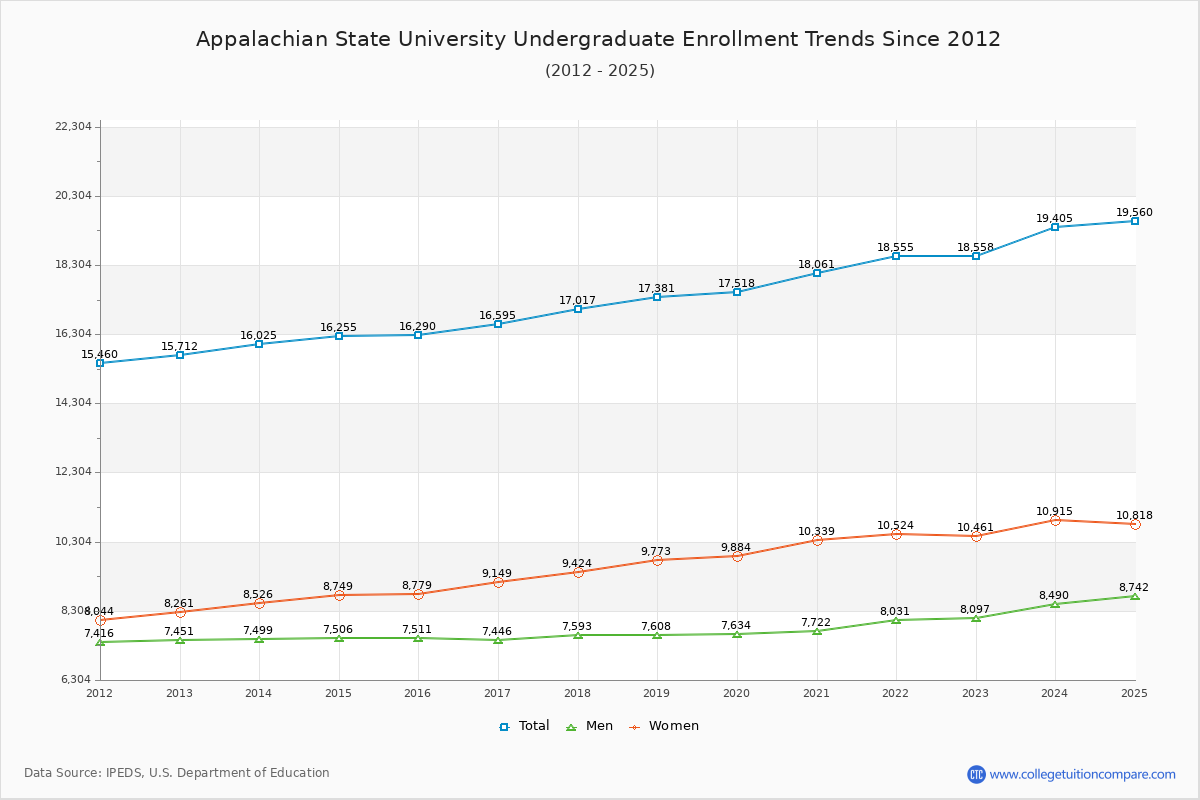
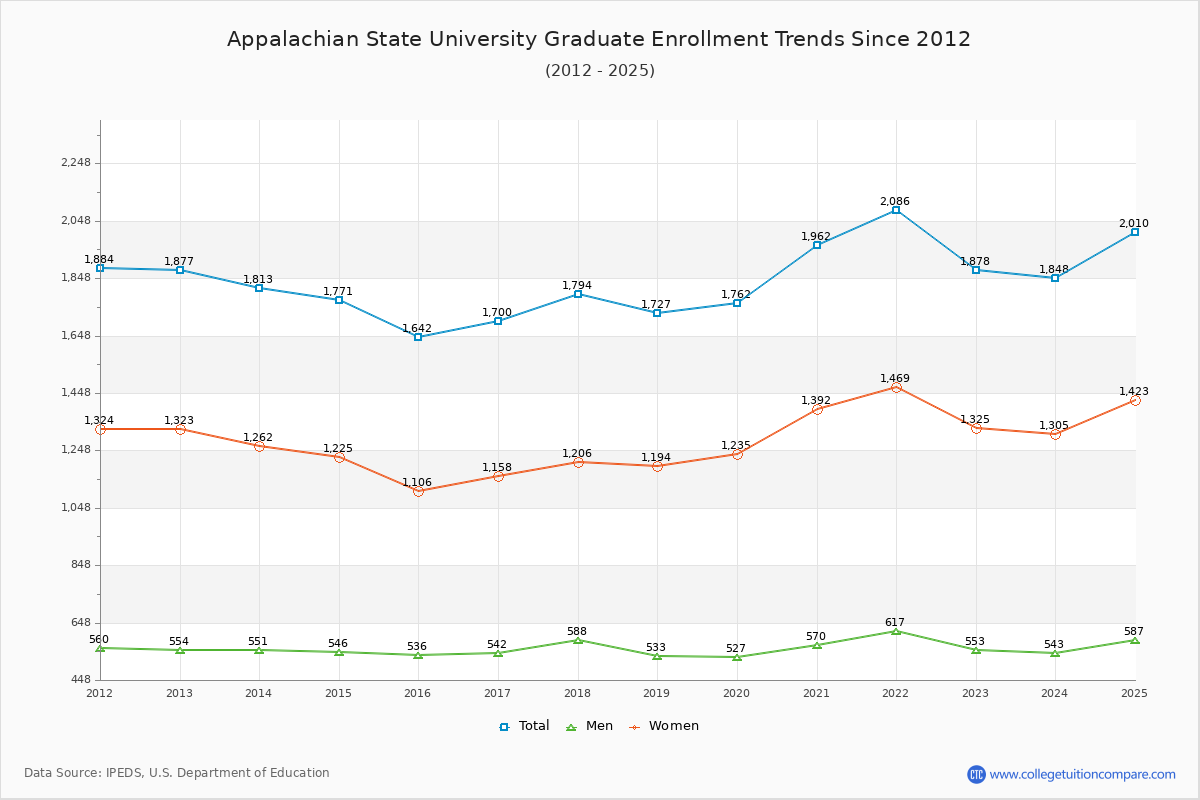
90.81% of total students is undergraduate students and 9.19% students is graduate students. The number of undergraduate students has increased by 2,846 and the graduate enrollment has increased by 1 over past 10 years.
The female to male ratio is 1.36 to 1 and it means that there are more female students enrolled in Appalachian State than male students.
The following table and chart illustrate the changes in student population by gender at Appalachian State University since 2012.
| Year | Total | Undergraduate | Graduate | ||||
|---|---|---|---|---|---|---|---|
| Total | Men | Women | Total | Men | Women | ||
| 2012-13 | 17,589 | 15,712 | 7,451 | 8,261 | 1,877 | 554 | 1,323 |
| 2013-14 | 17,838 249 | 16,025 313 | 7,499 48 | 8,526 265 | 1,813 -64 | 551 -3 | 1,262 -61 |
| 2014-15 | 18,026 188 | 16,255 230 | 7,506 7 | 8,749 223 | 1,771 -42 | 546 -5 | 1,225 -37 |
| 2015-16 | 17,932 -94 | 16,290 35 | 7,511 5 | 8,779 30 | 1,642 -129 | 536 -10 | 1,106 -119 |
| 2016-17 | 18,295 363 | 16,595 305 | 7,446 -65 | 9,149 370 | 1,700 58 | 542 6 | 1,158 52 |
| 2017-18 | 18,811 516 | 17,017 422 | 7,593 147 | 9,424 275 | 1,794 94 | 588 46 | 1,206 48 |
| 2018-19 | 19,108 297 | 17,381 364 | 7,608 15 | 9,773 349 | 1,727 -67 | 533 -55 | 1,194 -12 |
| 2019-20 | 19,280 172 | 17,518 137 | 7,634 26 | 9,884 111 | 1,762 35 | 527 -6 | 1,235 41 |
| 2020-21 | 20,023 743 | 18,061 543 | 7,722 88 | 10,339 455 | 1,962 200 | 570 43 | 1,392 157 |
| 2021-22 | 20,641 618 | 18,555 494 | 8,031 309 | 10,524 185 | 2,086 124 | 617 47 | 1,469 77 |
| 2022-23 | 20,436 -205 | 18,558 3 | 8,097 66 | 10,461 -63 | 1,878 -208 | 553 -64 | 1,325 -144 |
| Average | 18,907 | 17,088 | 7,645 | 9,443 | 1,819 | 556 | 1,263 |