Enrollment Trends at AU Seattle

115

Total Enrollment

14

Men

101

Women

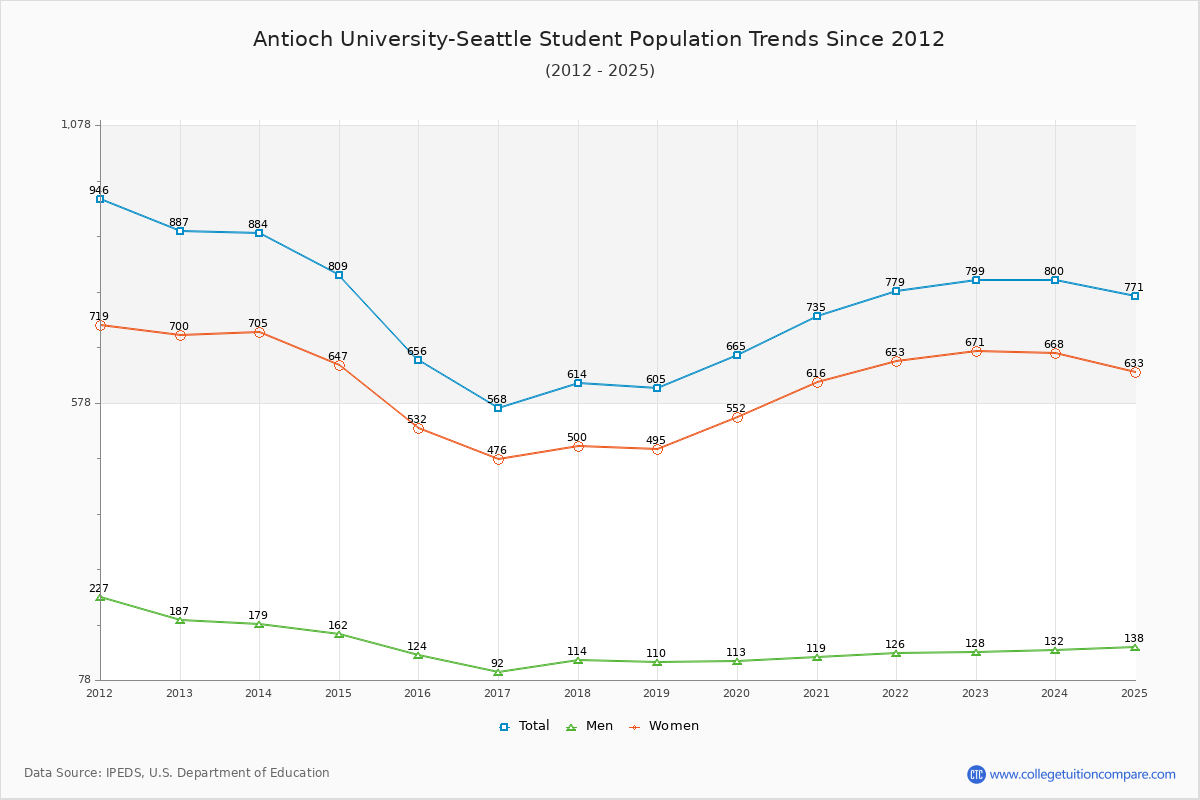
The student population at Antioch University-Seattle is 771 (74 undergraduate and 697 graduate students) . The number of students has increased by 115 over the past decade.

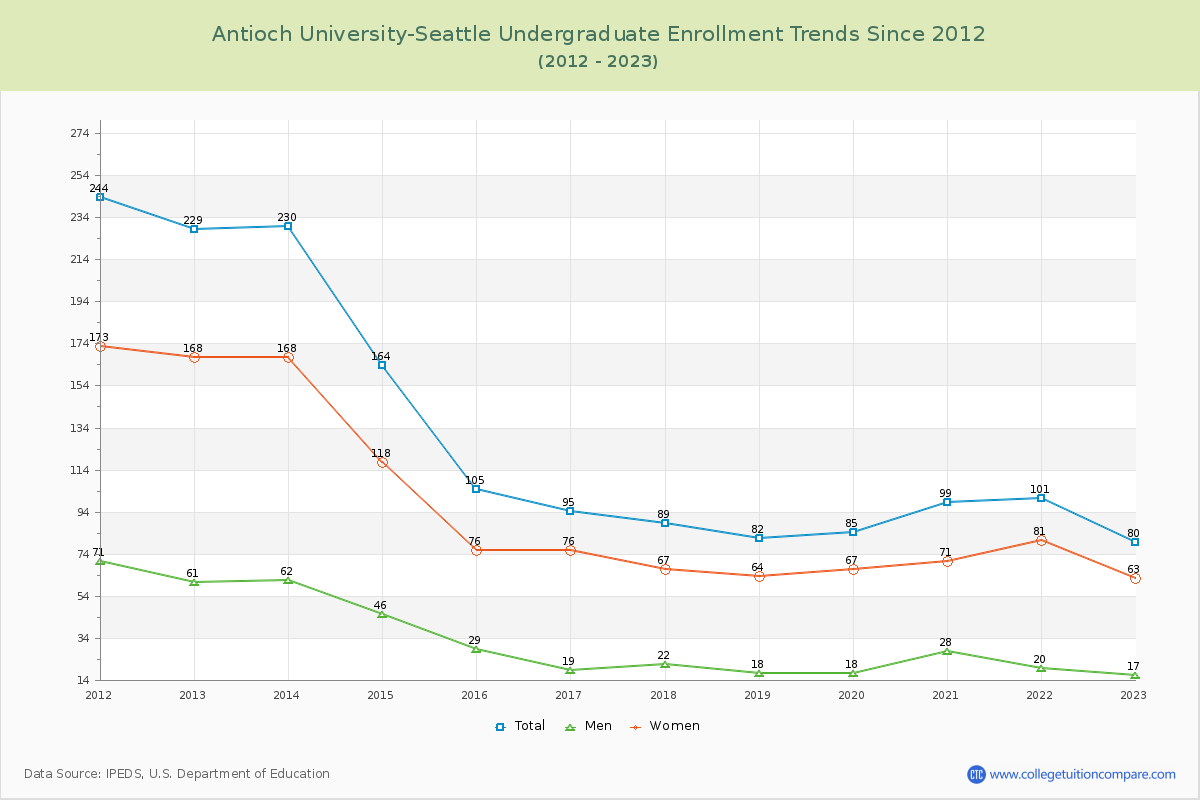
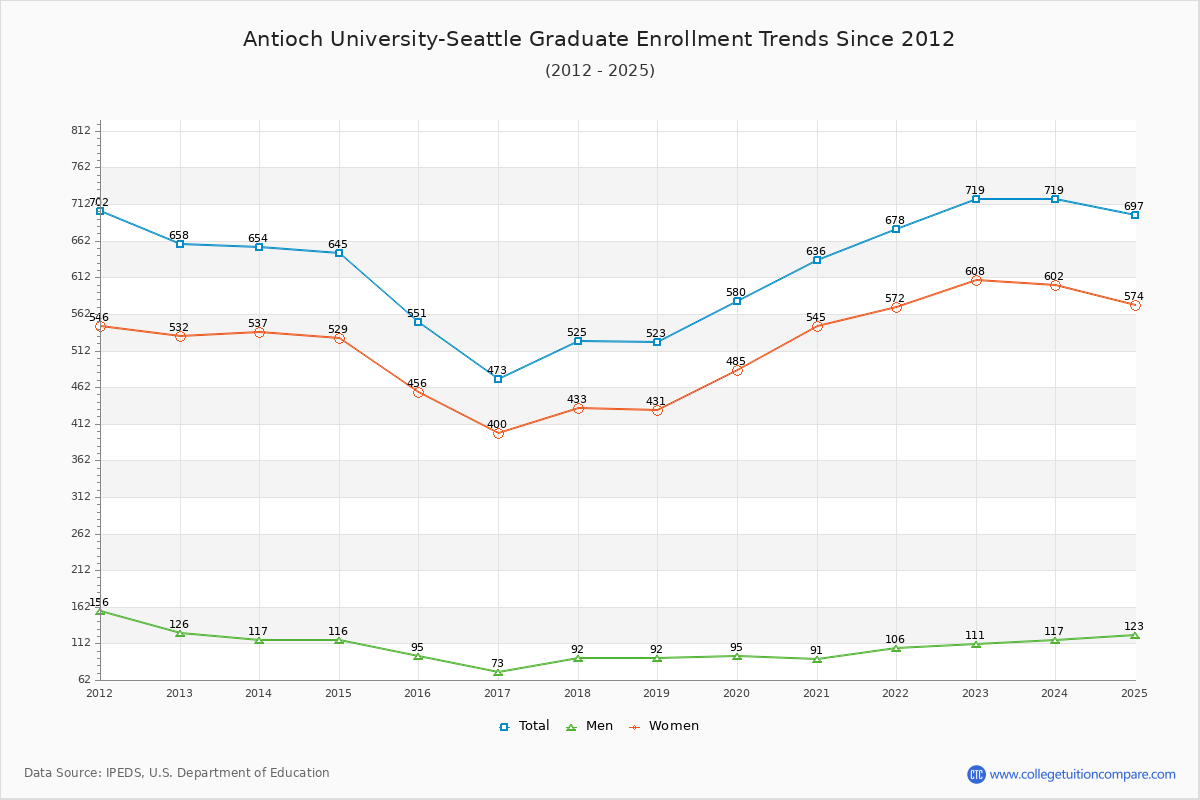
The percentage of undergraduate students at AU Seattle is 9.60% which is decreased by 31 over last 10 years. The graduate student population increased by 146 and it has been increasing.

The female to male ratio is 4.59 to 1 which means that majority of population is on female students.

16 students enrolled in online degree program exclusively and the number of online students has decreased by % since 2015.

Student Population Changes

The average student population over the last 11 years is 699 where 771 students are attending the school for the academic year 2024-2025.

9.60% of total students is undergraduate students and 90.40% students is graduate students. The number of undergraduate students has decreased by 31 and the graduate enrollment has increased by 146 over past 10 years.

The female to male ratio is 4.59 to 1 and it means that there are far more female students enrolled in AU Seattle than male students.

The following table and chart illustrate the changes in student population by gender at Antioch University-Seattle since 2015.

YearTotalUndergraduateGraduate
TotalMenWomenTotalMenWomen
2015-16656105297655195456
2016-17568
-88
95
-10
19
-10
76473
-78
73
-22
400
-56
2017-18614
46
89
-6
22
3
67
-9
525
52
92
19
433
33
2018-19605
-9
82
-7
18
-4
64
-3
523
-2
92431
-2
2019-20665
60
85
3
1867
3
580
57
95
3
485
54
2020-21735
70
99
14
28
10
71
4
636
56
91
-4
545
60
2021-22779
44
101
2
20
-8
81
10
678
42
106
15
572
27
2022-23799
20
80
-21
17
-3
63
-18
719
41
111
5
608
36
2023-24800
1
81
1
15
-2
66
3
719117
6
602
-6
2024-25771
-29
74
-7
1559
-7
697
-22
123
6
574
-28
Average699892069610100511
Antioch University-Seattle Enrollment Trends Chart

Undergraduate Enrollment Changes

The average number of Undergraduate students over the last 11 years is 89 where 74 students are attending the Undergraduate school for the academic year 2024-2025. The following table and chart illustrate the changes in Undergraduate enrollment by attending status and gender at Antioch University-Seattle since 2015.

YearTotalFull-timePart-time
TotalMenWomenTotalMenWomen
2015-161051129942767
2016-179512111831865
2017-188917512721755
2018-198227126551738
2019-20851037751560
2020-21991147882464
2021-221011156901575
2022-23801037701456
2023-24811761164955
2024-2574835661254
Average8989310891759
Antioch University-Seattle Undergraduate Enrollment Trends Chart

Graduate Enrollment Changes

The average number of Graduate students over the last 11 years is 610 where 697 students are attending the Graduate school for the academic year 2024-2025. The following table and chart illustrate the changes in Graduate enrollment by attending status and gender at Antioch University-Seattle since 2015.

YearTotalFull-timePart-time
TotalMenWomenTotalMenWomen
2015-165513937332015822136
2016-174733315727414216126
2017-185253827131114321122
2018-195233756531014827121
2019-205804106734317028142
2020-216364306736320624182
2021-226784858140419325168
2022-237195098042921031179
2023-247194897841123039191
2024-256975249243217331142
Average6106107336061026151
Antioch University-Seattle Graduate Enrollment Trends Chart

Enrollment by Race/Ethnicity Changes

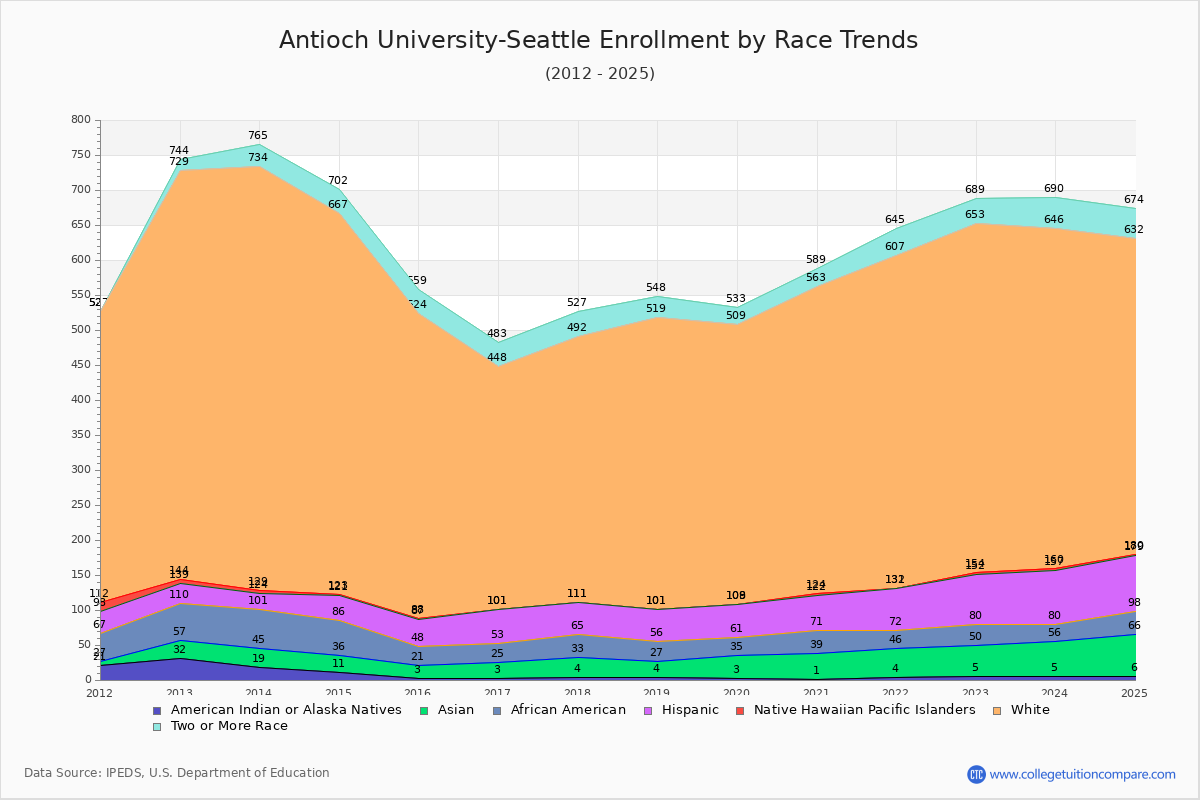
The percentage of white students is 58.63%. The percentage was 66.46% 10 years ago and AU Seattle still has a high percentage of white students. 7.78% of enrolled students is Asian and 4.15% is black students. Hispanic students comprise 10.51% of the student body.

Over the past 10 years, the racial composition has shifted. The percentage of white students decreased from 66.46% to 58.63%. Asian enrollment grew from 2.74% to 7.78%. Black student enrollment increased from 4.12% to 4.15%. Hispanic student representation expanded from 5.95% to 10.51%.

The overall racial diversity, measured by the Census Bureau Diversity Index, is 0.6345 which indicates that moderately diverse. This increased from 0.5494 a decade ago, suggesting that racial diversity has improved.

The following table and chart illustrate the student population trends by race/ethnicity at Antioch University-Seattle over the past 11 years (2015-2025).

YearAmerican Indian or Native AmericanAsianBlackHispanicNative Hawaiian or Other Pacific IslanderWhiteTwo or More Races
2015-163182739143635
2016-173222848034735
2017-184293246038135
2018-194232945041829
2019-203322647140024
2020-211383251243926
2021-224422659147538
2022-235453072249936
2023-245512477348644
2024-256603281145242
Average4362957143334
Antioch University-Seattle Enrollment by Race Trends Chart

Distance Learning (Online Courses) Enrollment Changes

16 students are enrolled in online degree programs exclusively for the academic year 2024-2025, which is 2% of total students. The number of online students has decreased % since 2015. The following table and chart illustrate the changes in the online student population by enrolled type at Antioch University-Seattle from 2015 to 2025.

YearTotal EnrollmentOnline CompletelyEnrolled in Some Online CoursesNot Enrolled in Online Courses
2015-1665600656
2016-1756800568
2017-1861400614
2018-1960500605
2019-20665068597
2020-2173573500
2021-2277977900
2022-23799050749
2023-24800061739
2024-2577116145610
Average69915332514

Ratings & Review

Share your experiences and thoughts about Antioch University-Seattle. It will be a great help to applicants and prospective students!