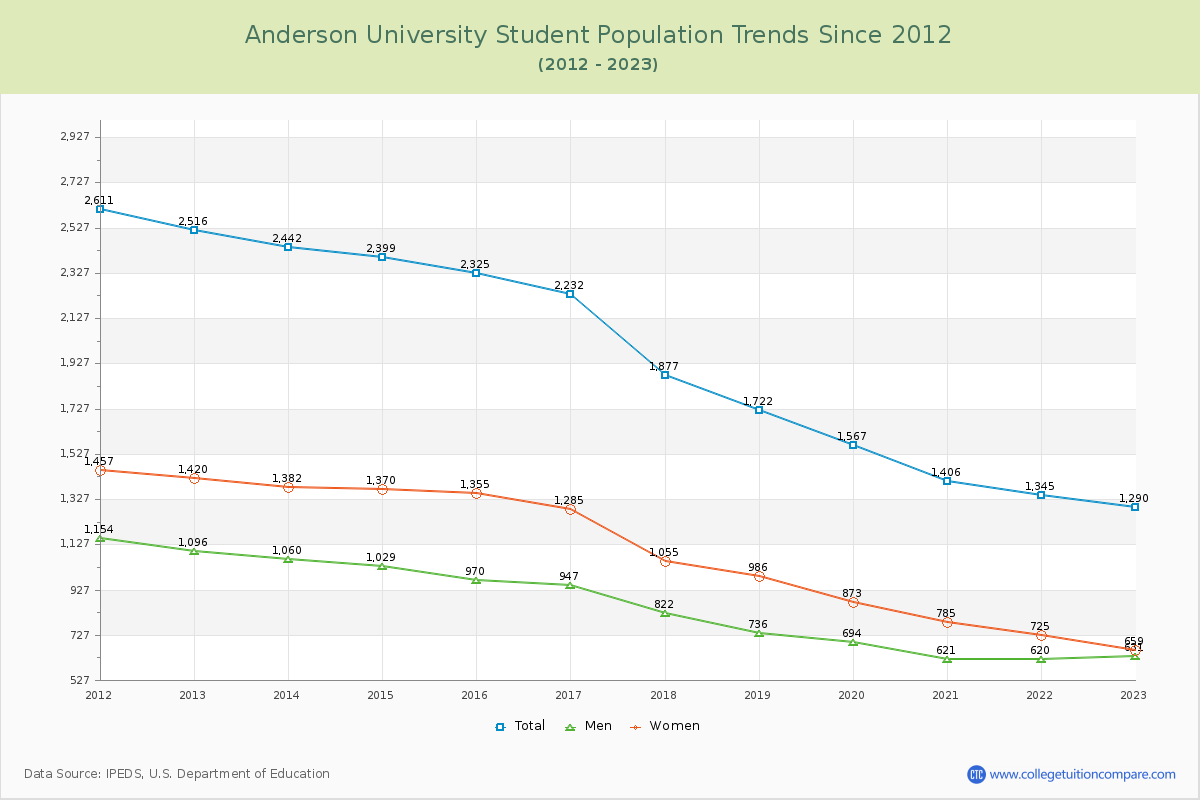
Student Population Changes
The average student population over the last 12 years is 1,920 where 1,290 students are attending the school for the academic year 2022-2023.
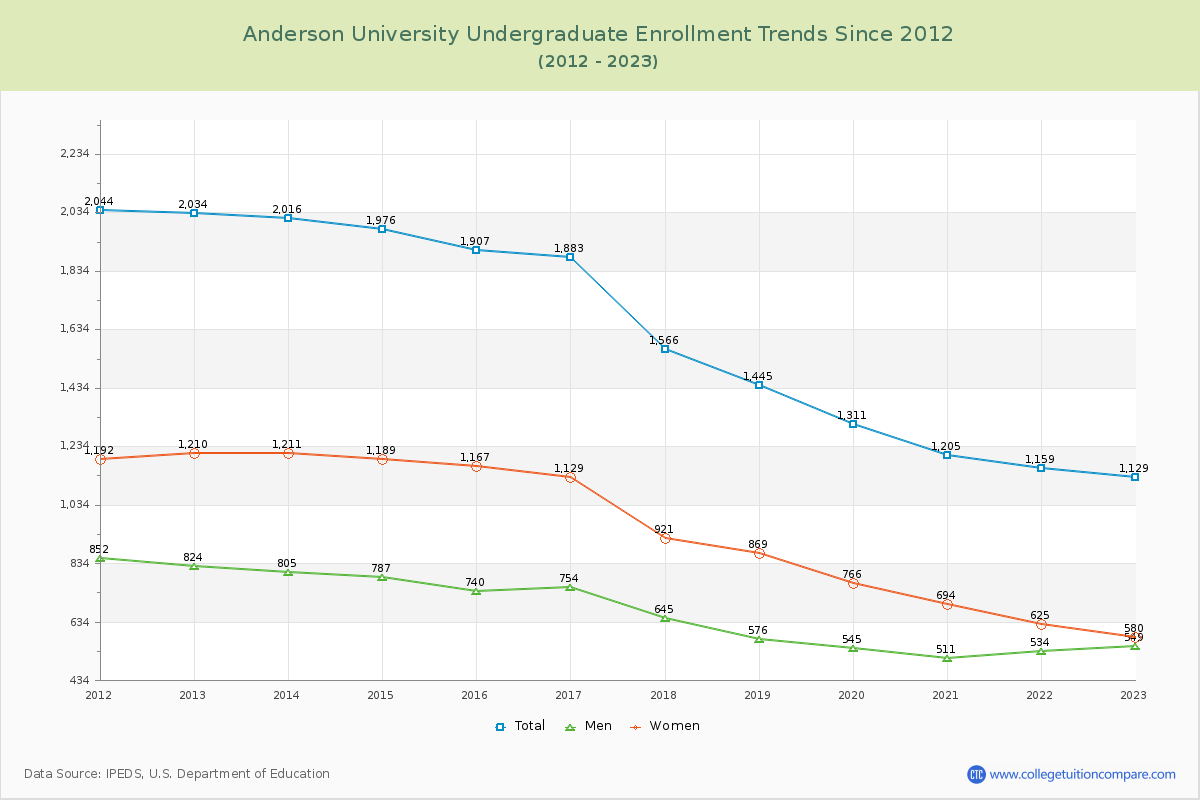
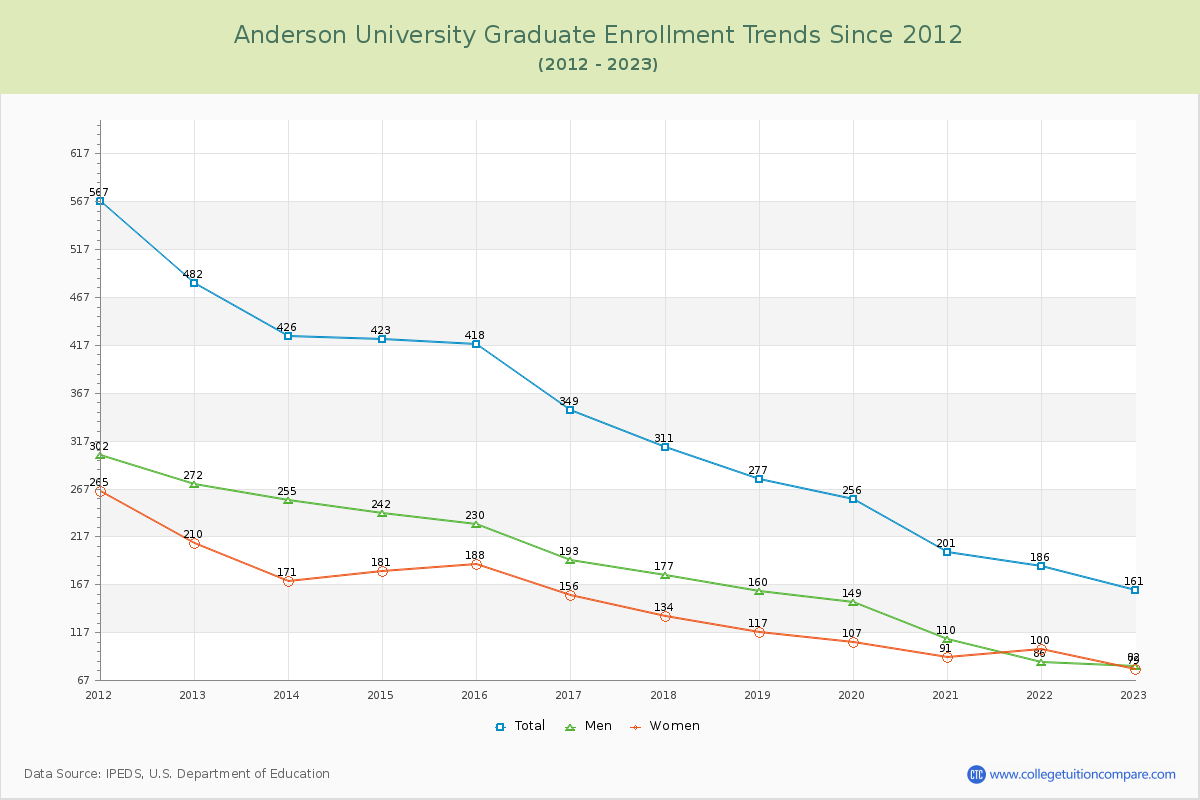
87.52% of total students is undergraduate students and 12.48% students is graduate students. The number of undergraduate students has decreased by 905 and the graduate enrollment has decreased by 321 over past 10 years.
The female to male ratio is 1.04 to 1 and it means that there are similar numbers of female and male students enrolled in Anderson.
The following table and chart illustrate the changes in student population by gender at Anderson University since 2012.
| Year | Total | Undergraduate | Graduate | ||||
|---|---|---|---|---|---|---|---|
| Total | Men | Women | Total | Men | Women | ||
| 2012-13 | 2,516 | 2,034 | 824 | 1,210 | 482 | 272 | 210 |
| 2013-14 | 2,442 -74 | 2,016 -18 | 805 -19 | 1,211 1 | 426 -56 | 255 -17 | 171 -39 |
| 2014-15 | 2,399 -43 | 1,976 -40 | 787 -18 | 1,189 -22 | 423 -3 | 242 -13 | 181 10 |
| 2015-16 | 2,325 -74 | 1,907 -69 | 740 -47 | 1,167 -22 | 418 -5 | 230 -12 | 188 7 |
| 2016-17 | 2,232 -93 | 1,883 -24 | 754 14 | 1,129 -38 | 349 -69 | 193 -37 | 156 -32 |
| 2017-18 | 1,877 -355 | 1,566 -317 | 645 -109 | 921 -208 | 311 -38 | 177 -16 | 134 -22 |
| 2018-19 | 1,722 -155 | 1,445 -121 | 576 -69 | 869 -52 | 277 -34 | 160 -17 | 117 -17 |
| 2019-20 | 1,567 -155 | 1,311 -134 | 545 -31 | 766 -103 | 256 -21 | 149 -11 | 107 -10 |
| 2020-21 | 1,406 -161 | 1,205 -106 | 511 -34 | 694 -72 | 201 -55 | 110 -39 | 91 -16 |
| 2021-22 | 1,345 -61 | 1,159 -46 | 534 23 | 625 -69 | 186 -15 | 86 -24 | 100 9 |
| 2022-23 | 1,290 -55 | 1,129 -30 | 549 15 | 580 -45 | 161 -25 | 82 -4 | 79 -21 |
| Average | 1,920 | 1,603 | 661 | 942 | 317 | 178 | 139 |