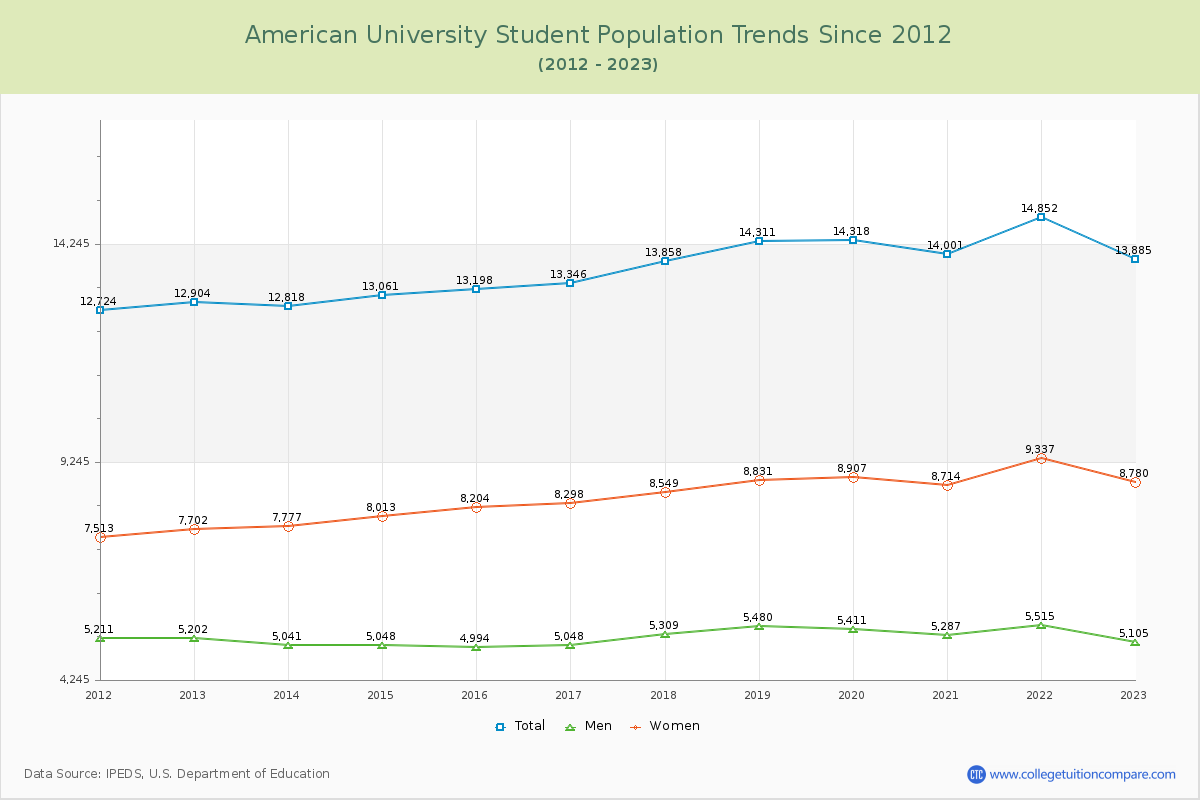
Student Population Changes
The average student population over the last 12 years is 13,687 where 13,885 students are attending the school for the academic year 2022-2023.
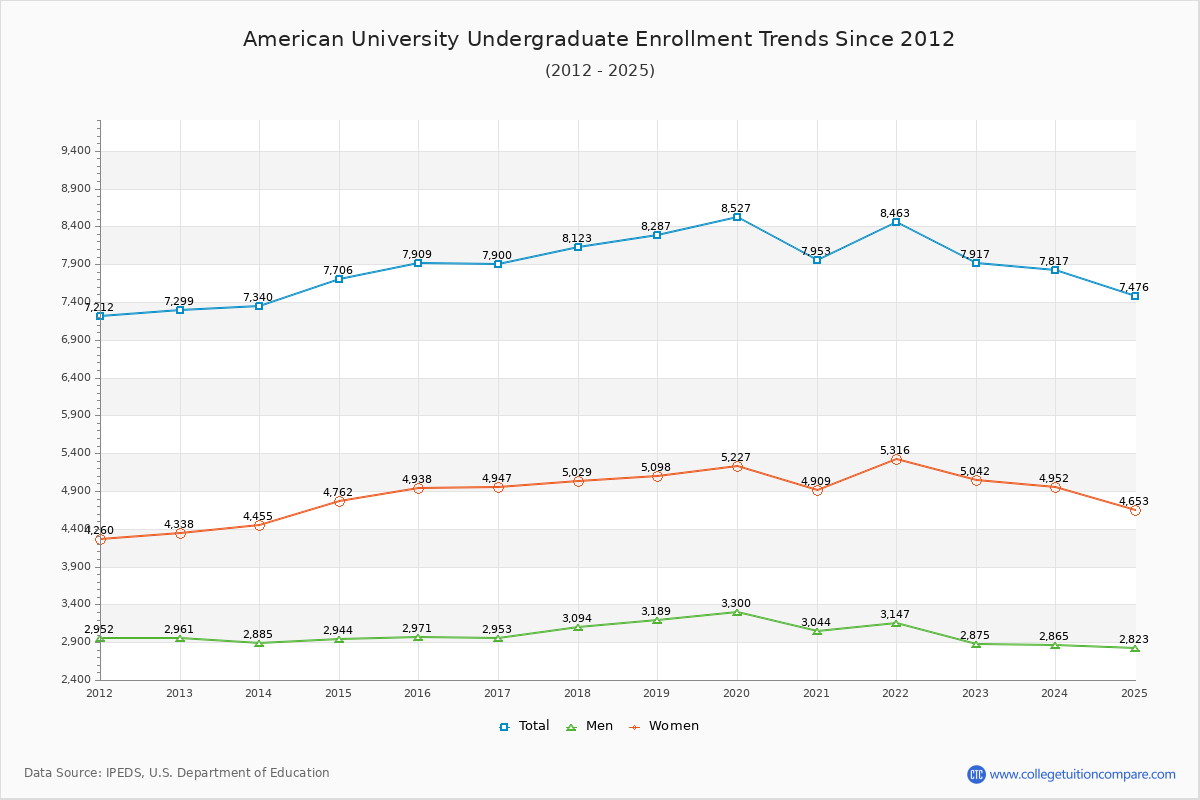
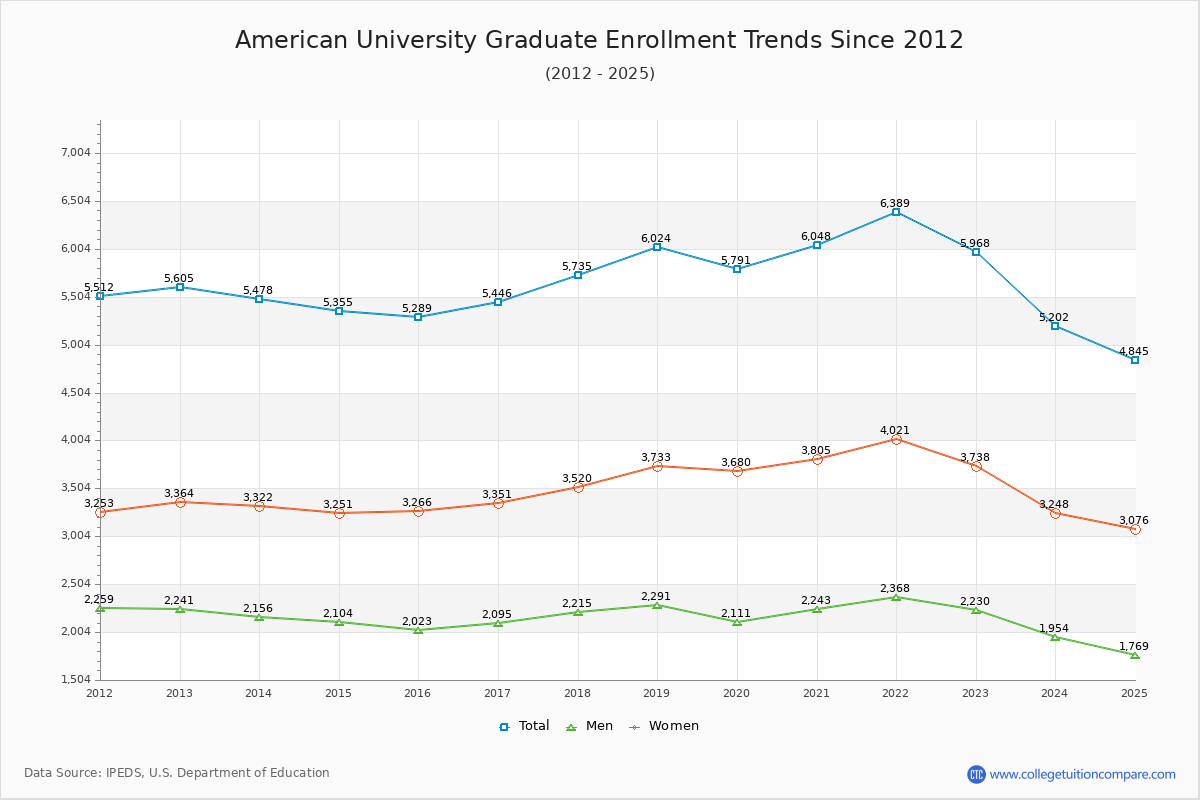
57.02% of total students is undergraduate students and 42.98% students is graduate students. The number of undergraduate students has increased by 618 and the graduate enrollment has increased by 363 over past 10 years.
The female to male ratio is 1.72 to 1 and it means that there are more female students enrolled in American than male students.
The following table and chart illustrate the changes in student population by gender at American University since 2012.
| Year | Total | Undergraduate | Graduate | ||||
|---|---|---|---|---|---|---|---|
| Total | Men | Women | Total | Men | Women | ||
| 2012-13 | 12,904 | 7,299 | 2,961 | 4,338 | 5,605 | 2,241 | 3,364 |
| 2013-14 | 12,818 -86 | 7,340 41 | 2,885 -76 | 4,455 117 | 5,478 -127 | 2,156 -85 | 3,322 -42 |
| 2014-15 | 13,061 243 | 7,706 366 | 2,944 59 | 4,762 307 | 5,355 -123 | 2,104 -52 | 3,251 -71 |
| 2015-16 | 13,198 137 | 7,909 203 | 2,971 27 | 4,938 176 | 5,289 -66 | 2,023 -81 | 3,266 15 |
| 2016-17 | 13,346 148 | 7,900 -9 | 2,953 -18 | 4,947 9 | 5,446 157 | 2,095 72 | 3,351 85 |
| 2017-18 | 13,858 512 | 8,123 223 | 3,094 141 | 5,029 82 | 5,735 289 | 2,215 120 | 3,520 169 |
| 2018-19 | 14,311 453 | 8,287 164 | 3,189 95 | 5,098 69 | 6,024 289 | 2,291 76 | 3,733 213 |
| 2019-20 | 14,318 7 | 8,527 240 | 3,300 111 | 5,227 129 | 5,791 -233 | 2,111 -180 | 3,680 -53 |
| 2020-21 | 14,001 -317 | 7,953 -574 | 3,044 -256 | 4,909 -318 | 6,048 257 | 2,243 132 | 3,805 125 |
| 2021-22 | 14,852 851 | 8,463 510 | 3,147 103 | 5,316 407 | 6,389 341 | 2,368 125 | 4,021 216 |
| 2022-23 | 13,885 -967 | 7,917 -546 | 2,875 -272 | 5,042 -274 | 5,968 -421 | 2,230 -138 | 3,738 -283 |
| Average | 13,687 | 7,948 | 3,033 | 4,915 | 5,739 | 2,189 | 3,550 |