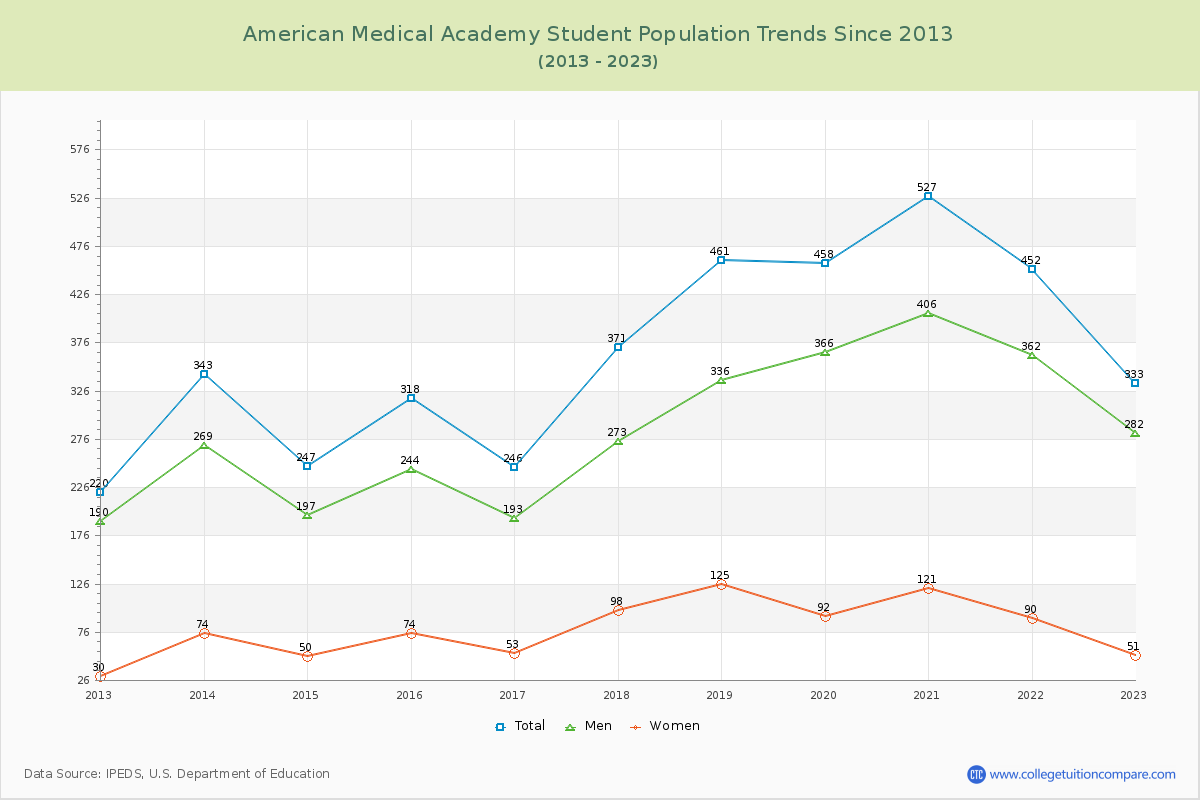
Student Population Changes
The average student population over the last 12 years is 361 where 333 students are attending the school for the academic year 2022-2023.
The female to male ratio is 0.18 to 1 and it means that there are far more male students enrolled in American Medical Academy than female students.
The following table and chart illustrate the changes in student population by gender at American Medical Academy since 2012.
| Year | Total | Men | Women |
|---|---|---|---|
| 2012-13 | 220 | 190 | 30 |
| 2013-14 | 343 123 | 269 79 | 74 44 |
| 2014-15 | 247 -96 | 197 -72 | 50 -24 |
| 2015-16 | 318 71 | 244 47 | 74 24 |
| 2016-17 | 246 -72 | 193 -51 | 53 -21 |
| 2017-18 | 371 125 | 273 80 | 98 45 |
| 2018-19 | 461 90 | 336 63 | 125 27 |
| 2019-20 | 458 -3 | 366 30 | 92 -33 |
| 2020-21 | 527 69 | 406 40 | 121 29 |
| 2021-22 | 452 -75 | 362 -44 | 90 -31 |
| 2022-23 | 333 -119 | 282 -80 | 51 -39 |
| Average | 361 | 283 | 78 |