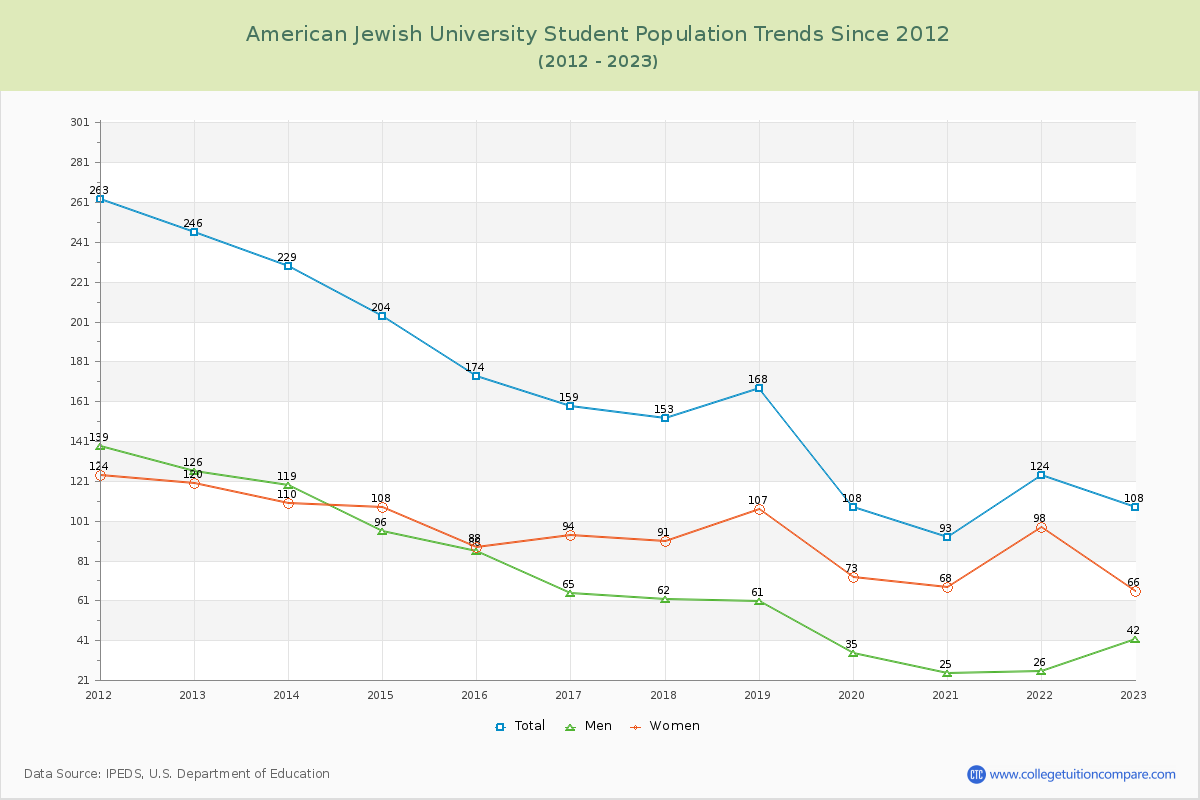
Student Population Changes
The average student population over the last 12 years is 161 where 108 students are attending the school for the academic year 2022-2023.
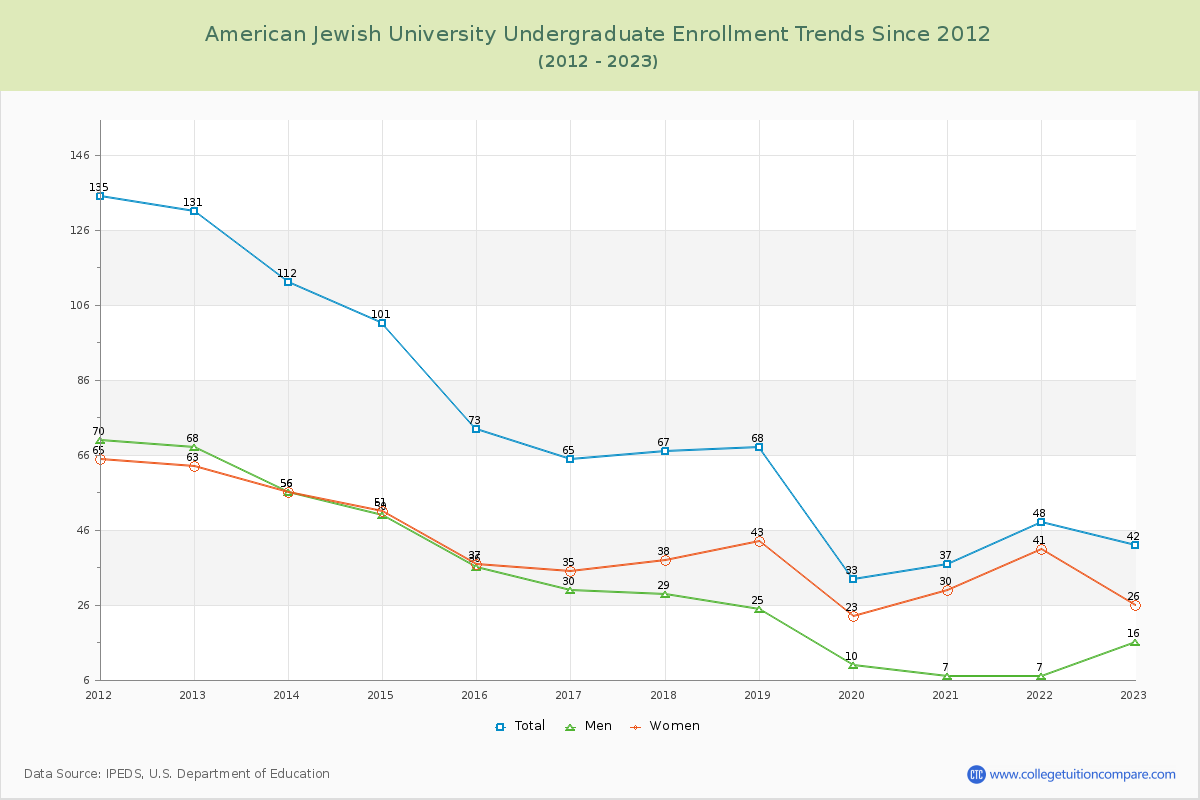
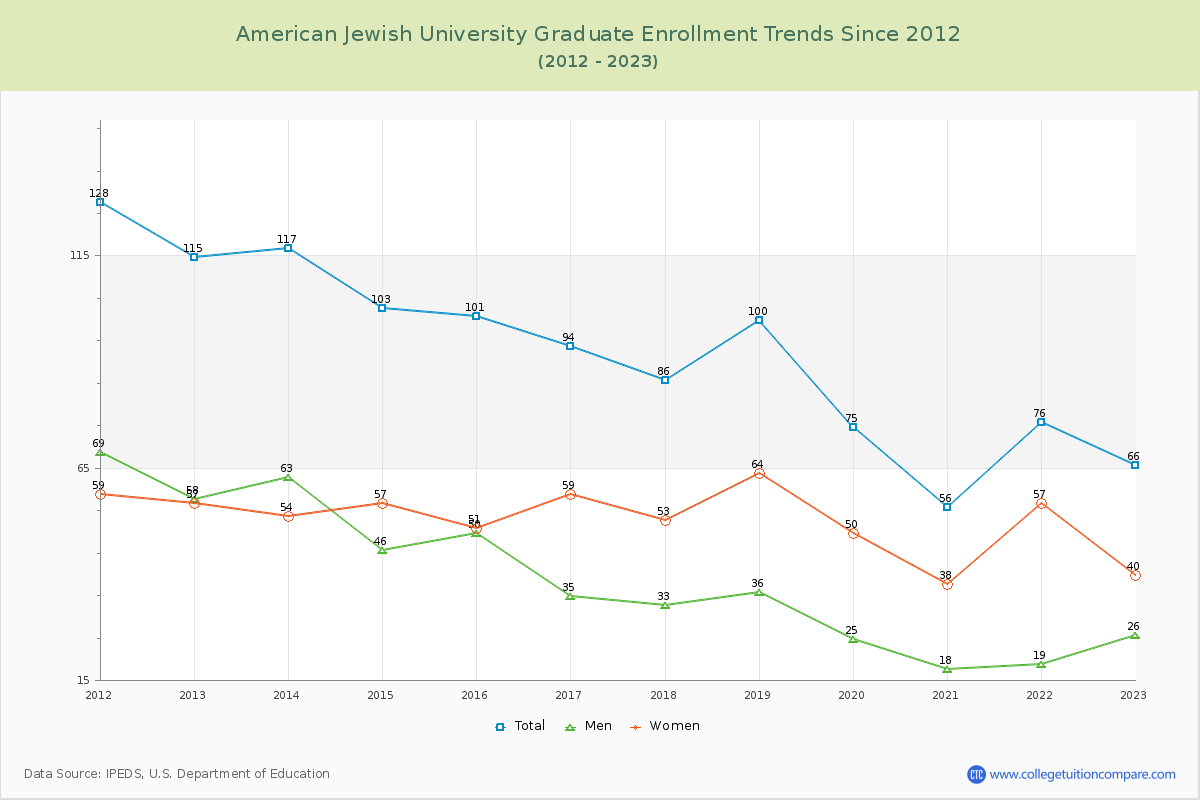
38.89% of total students is undergraduate students and 61.11% students is graduate students. The number of undergraduate students has decreased by 89 and the graduate enrollment has decreased by 49 over past 10 years.
The female to male ratio is 1.57 to 1 and it means that there are more female students enrolled in AJU than male students.
The following table and chart illustrate the changes in student population by gender at American Jewish University since 2012.
| Year | Total | Undergraduate | Graduate | ||||
|---|---|---|---|---|---|---|---|
| Total | Men | Women | Total | Men | Women | ||
| 2012-13 | 246 | 131 | 68 | 63 | 115 | 58 | 57 |
| 2013-14 | 229 -17 | 112 -19 | 56 -12 | 56 -7 | 117 2 | 63 5 | 54 -3 |
| 2014-15 | 204 -25 | 101 -11 | 50 -6 | 51 -5 | 103 -14 | 46 -17 | 57 3 |
| 2015-16 | 174 -30 | 73 -28 | 36 -14 | 37 -14 | 101 -2 | 50 4 | 51 -6 |
| 2016-17 | 159 -15 | 65 -8 | 30 -6 | 35 -2 | 94 -7 | 35 -15 | 59 8 |
| 2017-18 | 153 -6 | 67 2 | 29 -1 | 38 3 | 86 -8 | 33 -2 | 53 -6 |
| 2018-19 | 168 15 | 68 1 | 25 -4 | 43 5 | 100 14 | 36 3 | 64 11 |
| 2019-20 | 108 -60 | 33 -35 | 10 -15 | 23 -20 | 75 -25 | 25 -11 | 50 -14 |
| 2020-21 | 93 -15 | 37 4 | 7 -3 | 30 7 | 56 -19 | 18 -7 | 38 -12 |
| 2021-22 | 124 31 | 48 11 | 7 0 | 41 11 | 76 20 | 19 1 | 57 19 |
| 2022-23 | 108 -16 | 42 -6 | 16 9 | 26 -15 | 66 -10 | 26 7 | 40 -17 |
| Average | 161 | 71 | 30 | 40 | 90 | 37 | 53 |