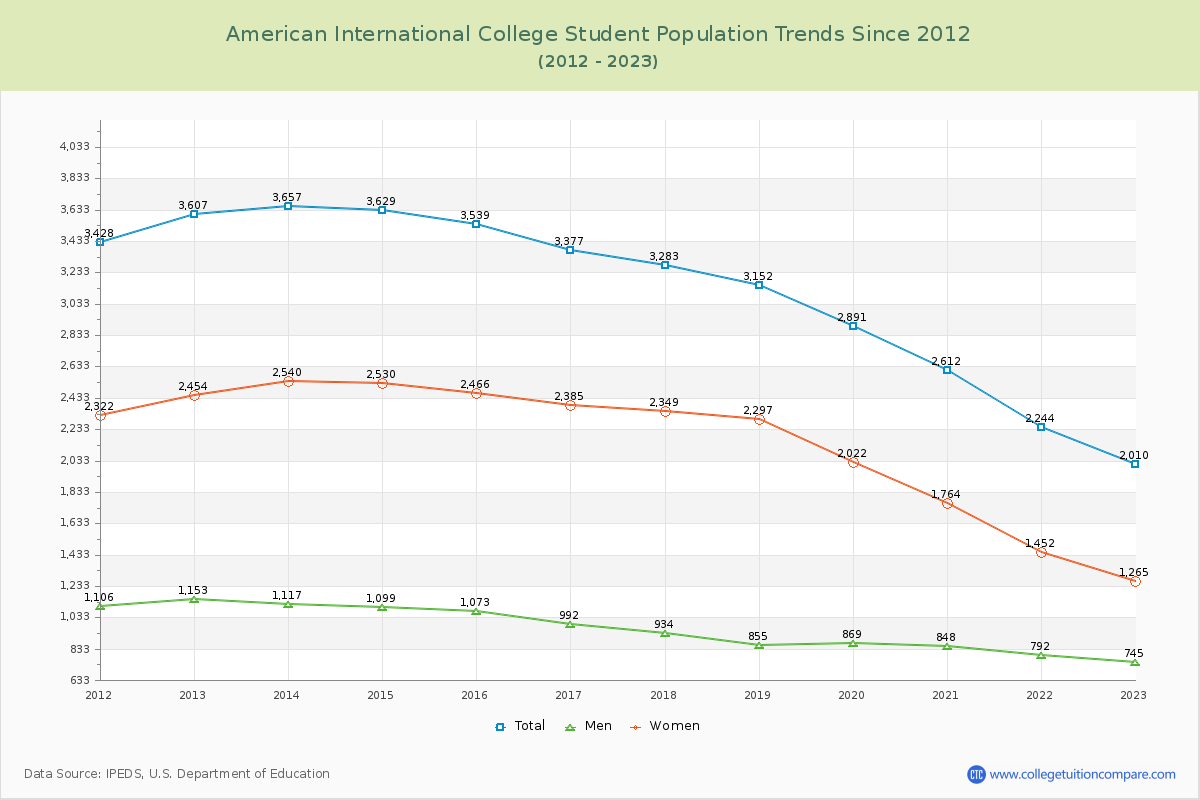
Student Population Changes
The average student population over the last 12 years is 3,091 where 2,010 students are attending the school for the academic year 2022-2023.
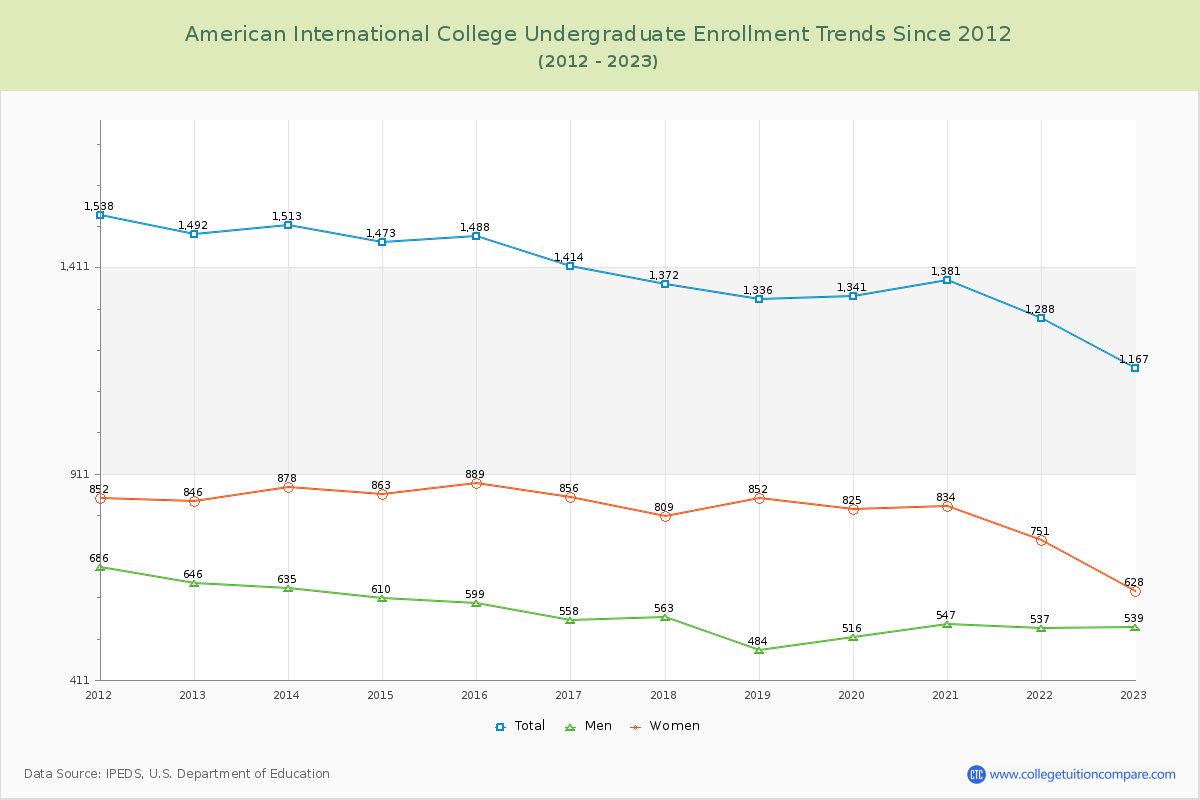
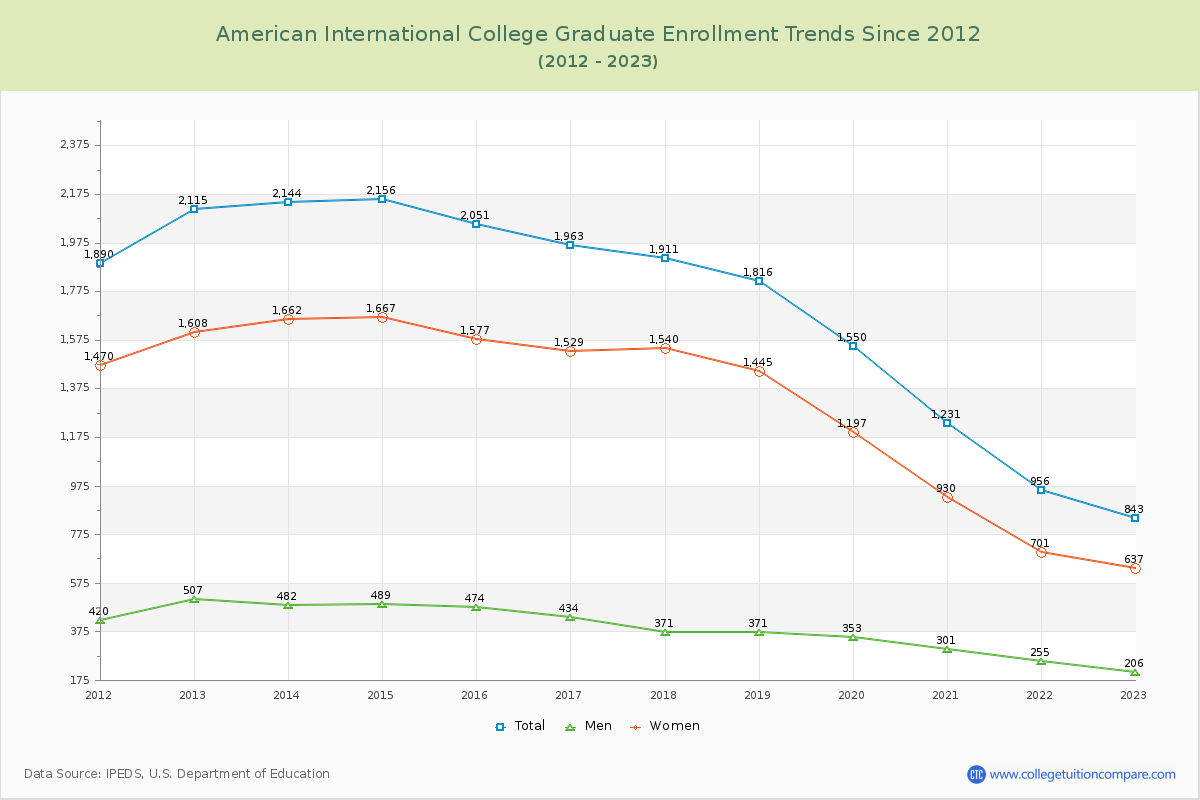
58.06% of total students is undergraduate students and 41.94% students is graduate students. The number of undergraduate students has decreased by 325 and the graduate enrollment has decreased by 1,272 over past 10 years.
The female to male ratio is 1.70 to 1 and it means that there are more female students enrolled in AIC than male students.
The following table and chart illustrate the changes in student population by gender at American International College since 2012.
| Year | Total | Undergraduate | Graduate | ||||
|---|---|---|---|---|---|---|---|
| Total | Men | Women | Total | Men | Women | ||
| 2012-13 | 3,607 | 1,492 | 646 | 846 | 2,115 | 507 | 1,608 |
| 2013-14 | 3,657 50 | 1,513 21 | 635 -11 | 878 32 | 2,144 29 | 482 -25 | 1,662 54 |
| 2014-15 | 3,629 -28 | 1,473 -40 | 610 -25 | 863 -15 | 2,156 12 | 489 7 | 1,667 5 |
| 2015-16 | 3,539 -90 | 1,488 15 | 599 -11 | 889 26 | 2,051 -105 | 474 -15 | 1,577 -90 |
| 2016-17 | 3,377 -162 | 1,414 -74 | 558 -41 | 856 -33 | 1,963 -88 | 434 -40 | 1,529 -48 |
| 2017-18 | 3,283 -94 | 1,372 -42 | 563 5 | 809 -47 | 1,911 -52 | 371 -63 | 1,540 11 |
| 2018-19 | 3,152 -131 | 1,336 -36 | 484 -79 | 852 43 | 1,816 -95 | 371 0 | 1,445 -95 |
| 2019-20 | 2,891 -261 | 1,341 5 | 516 32 | 825 -27 | 1,550 -266 | 353 -18 | 1,197 -248 |
| 2020-21 | 2,612 -279 | 1,381 40 | 547 31 | 834 9 | 1,231 -319 | 301 -52 | 930 -267 |
| 2021-22 | 2,244 -368 | 1,288 -93 | 537 -10 | 751 -83 | 956 -275 | 255 -46 | 701 -229 |
| 2022-23 | 2,010 -234 | 1,167 -121 | 539 2 | 628 -123 | 843 -113 | 206 -49 | 637 -64 |
| Average | 3,091 | 1,388 | 567 | 821 | 1,703 | 386 | 1,318 |