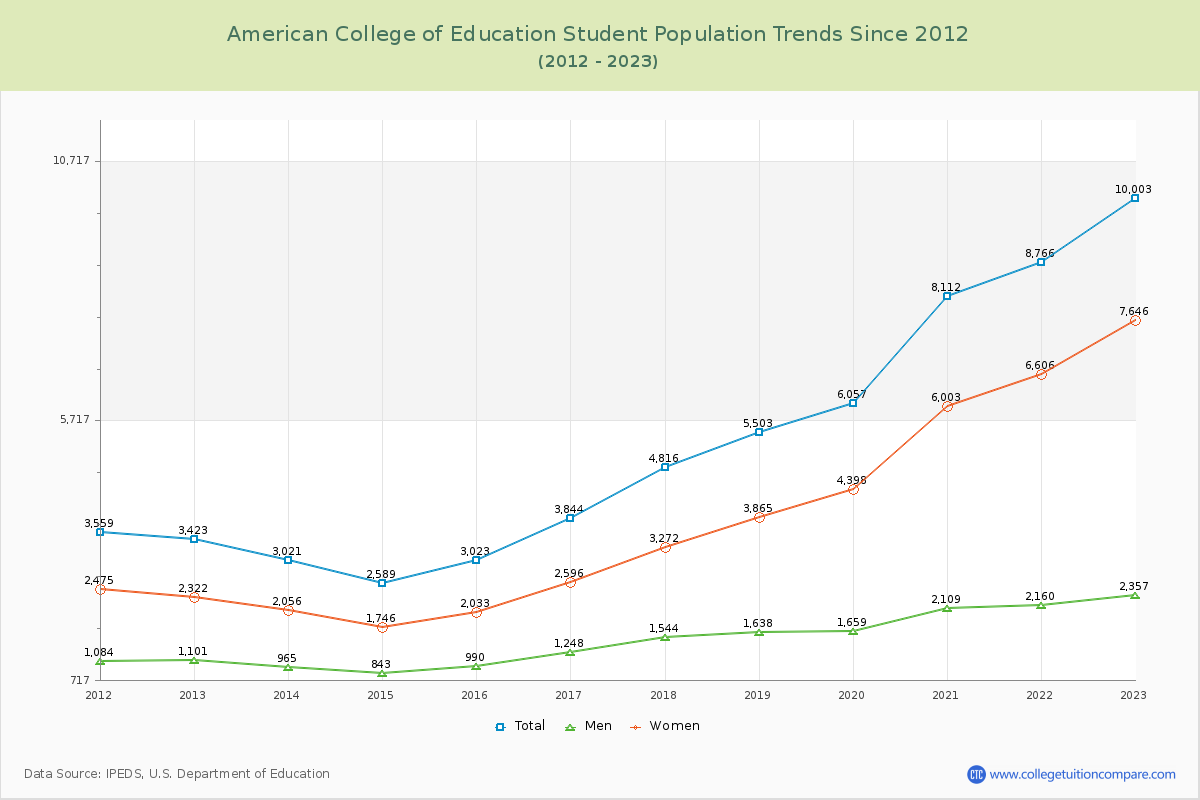
Student Population Changes
The average student population over the last 12 years is 5,378 where 10,003 students are attending the school for the academic year 2022-2023.
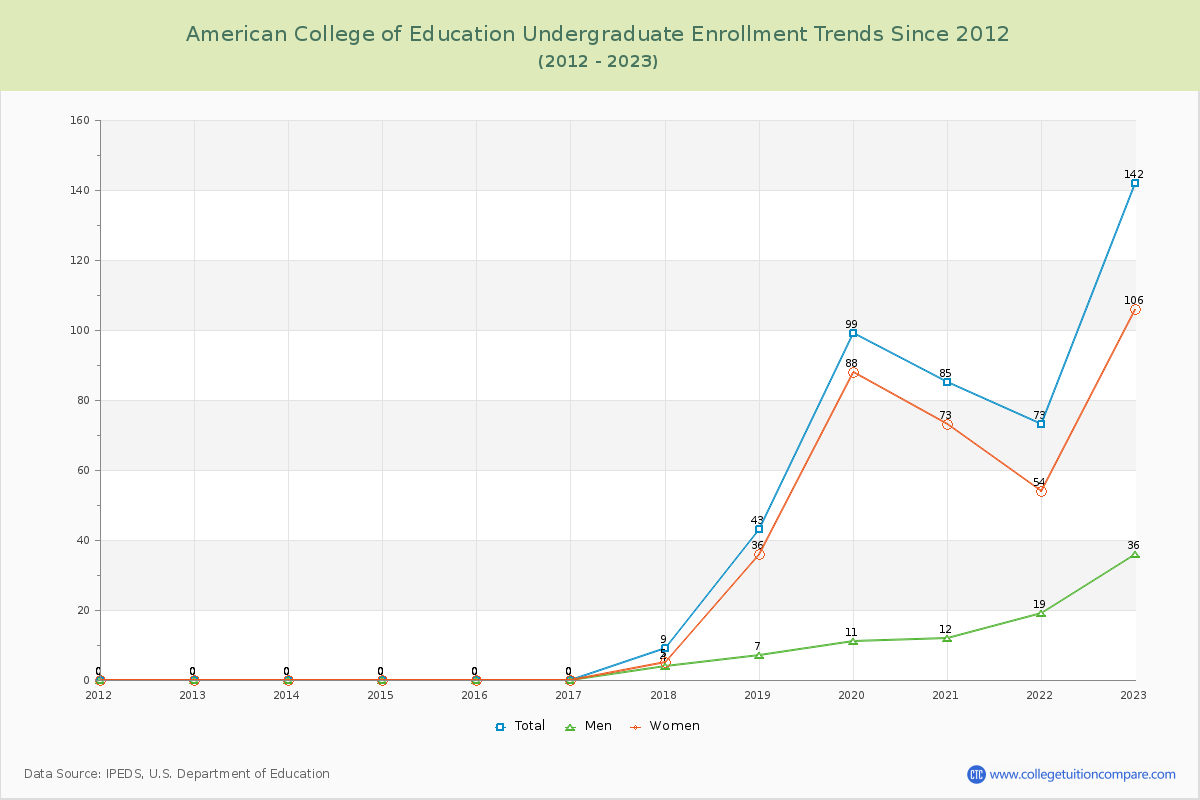
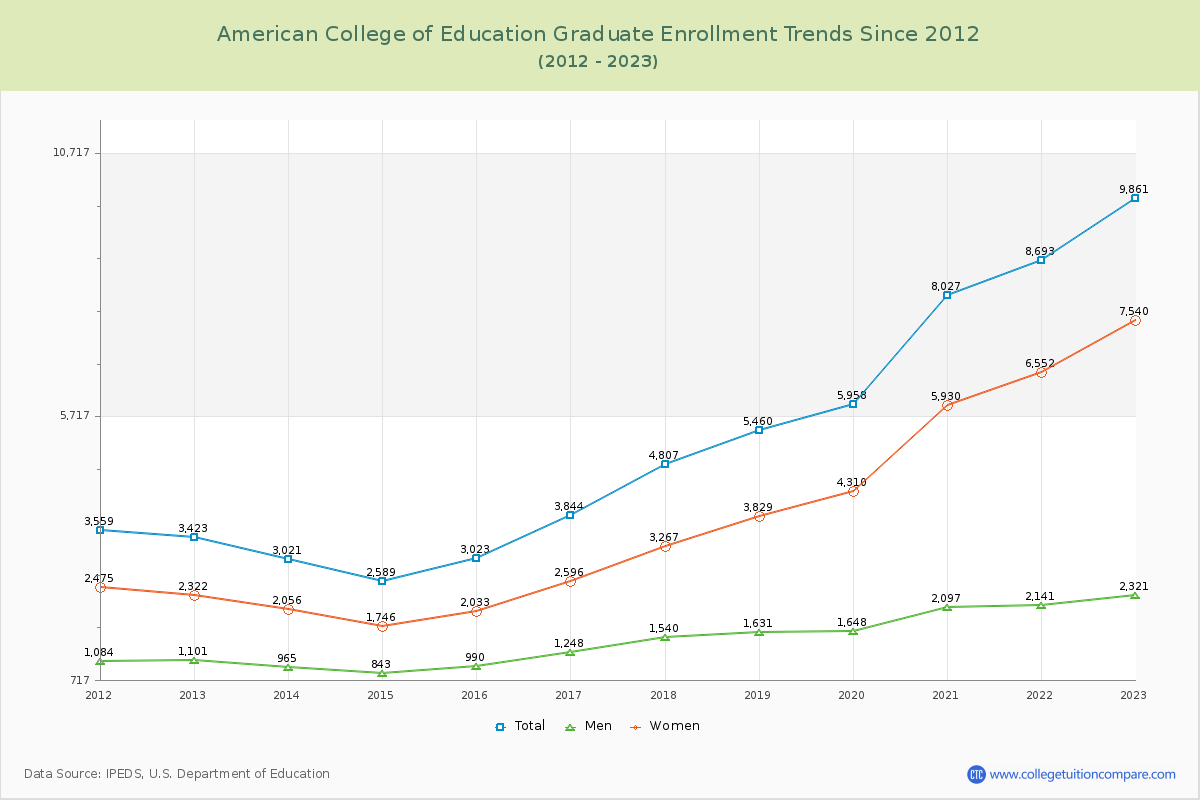
1.42% of total students is undergraduate students and 98.58% students is graduate students. The number of undergraduate students has increased by 142 and the graduate enrollment has increased by 6,438 over past 10 years.
The female to male ratio is 3.24 to 1 and it means that there are far more female students enrolled in American College of Education than male students.
The following table and chart illustrate the changes in student population by gender at American College of Education since 2012.
| Year | Total | Undergraduate | Graduate | ||||
|---|---|---|---|---|---|---|---|
| Total | Men | Women | Total | Men | Women | ||
| 2012-13 | 3,423 | 0 | 0 | 0 | 3,423 | 1,101 | 2,322 |
| 2013-14 | 3,021 -402 | 0 0 | 0 0 | 0 0 | 3,021 -402 | 965 -136 | 2,056 -266 |
| 2014-15 | 2,589 -432 | 0 0 | 0 0 | 0 0 | 2,589 -432 | 843 -122 | 1,746 -310 |
| 2015-16 | 3,023 434 | 0 0 | 0 0 | 0 0 | 3,023 434 | 990 147 | 2,033 287 |
| 2016-17 | 3,844 821 | 0 0 | 0 0 | 0 0 | 3,844 821 | 1,248 258 | 2,596 563 |
| 2017-18 | 4,816 972 | 9 9 | 4 4 | 5 5 | 4,807 963 | 1,540 292 | 3,267 671 |
| 2018-19 | 5,503 687 | 43 34 | 7 3 | 36 31 | 5,460 653 | 1,631 91 | 3,829 562 |
| 2019-20 | 6,057 554 | 99 56 | 11 4 | 88 52 | 5,958 498 | 1,648 17 | 4,310 481 |
| 2020-21 | 8,112 2,055 | 85 -14 | 12 1 | 73 -15 | 8,027 2,069 | 2,097 449 | 5,930 1,620 |
| 2021-22 | 8,766 654 | 73 -12 | 19 7 | 54 -19 | 8,693 666 | 2,141 44 | 6,552 622 |
| 2022-23 | 10,003 1,237 | 142 69 | 36 17 | 106 52 | 9,861 1,168 | 2,321 180 | 7,540 988 |
| Average | 5,378 | 41 | 8 | 33 | 5,337 | 1,502 | 3,835 |