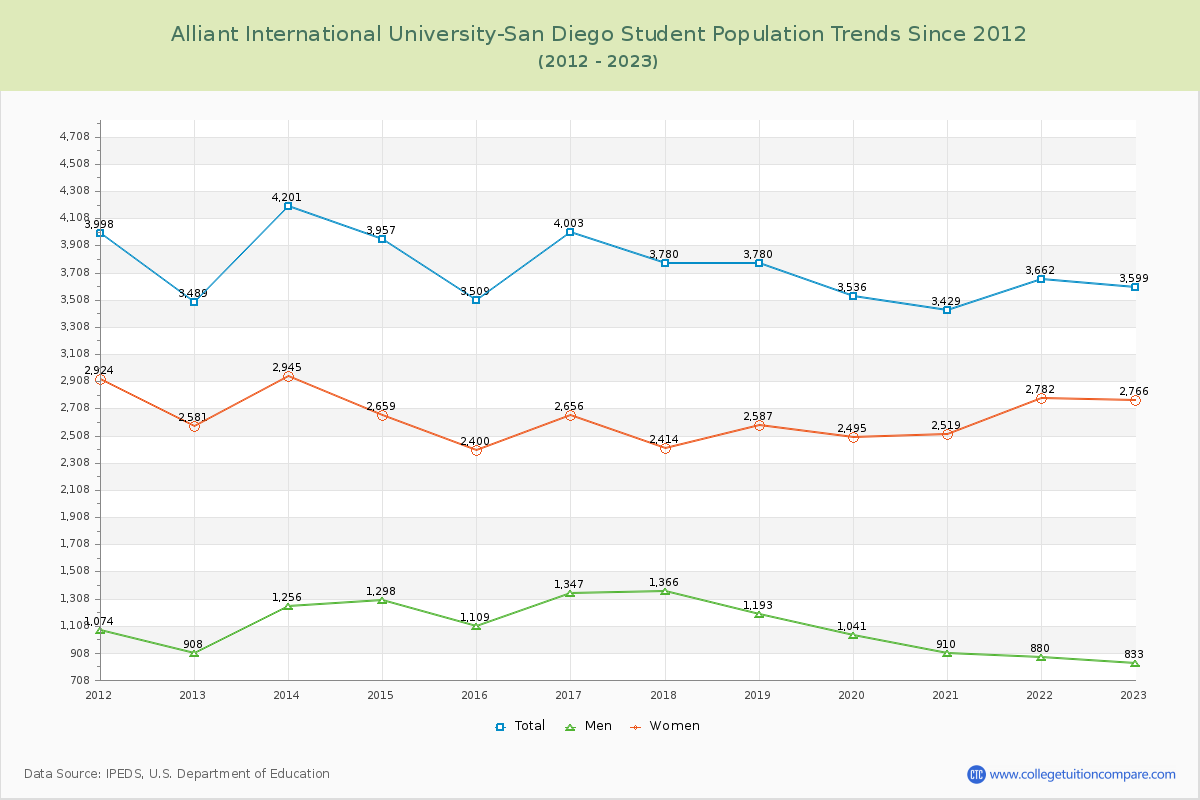
Student Population Changes
The average student population over the last 12 years is 3,722 where 3,599 students are attending the school for the academic year 2022-2023.
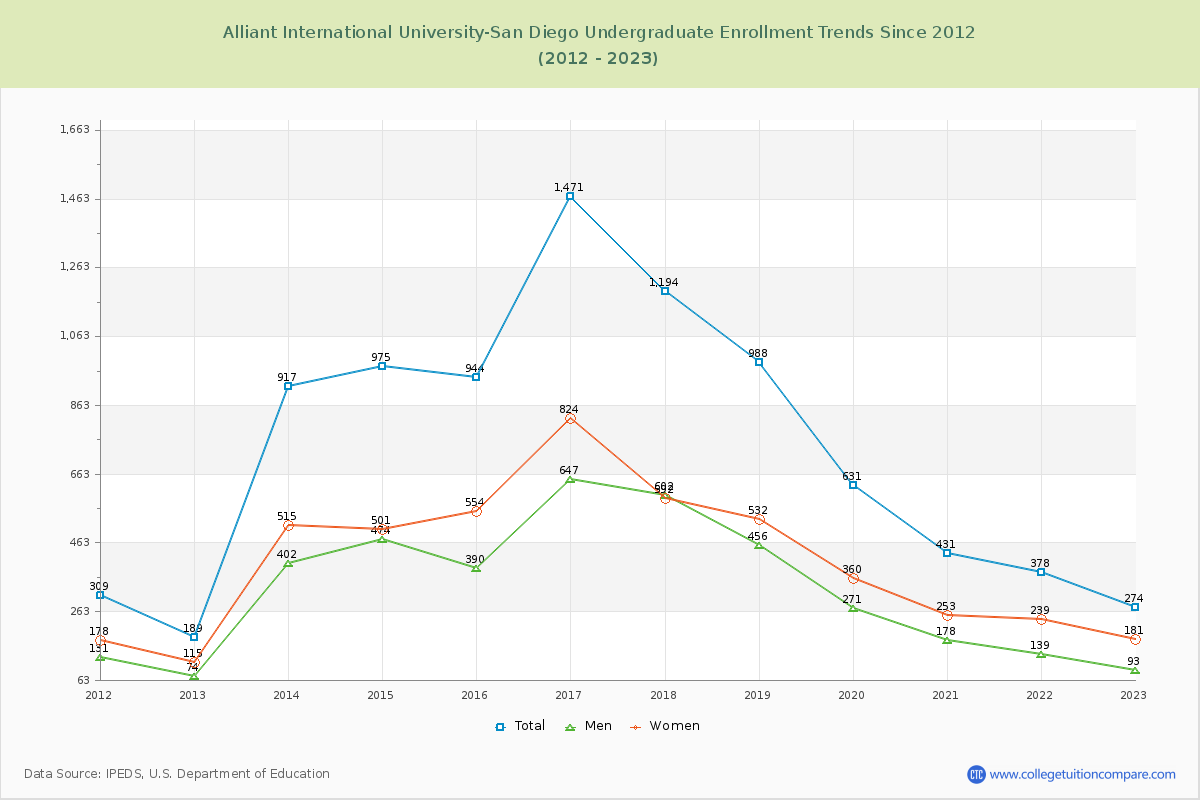
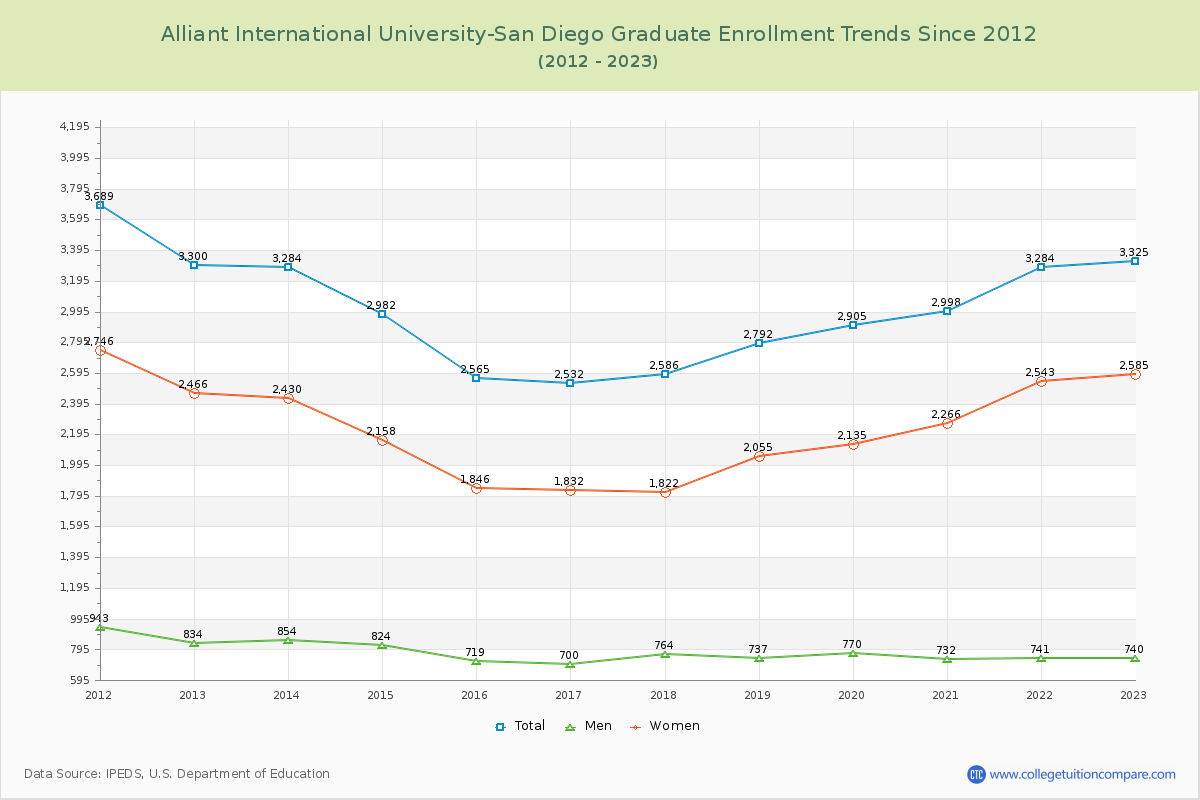
7.61% of total students is undergraduate students and 92.39% students is graduate students. The number of undergraduate students has increased by 85 and the graduate enrollment has increased by 25 over past 10 years.
The female to male ratio is 3.32 to 1 and it means that there are far more female students enrolled in Alliant International University-San Diego than male students.
The following table and chart illustrate the changes in student population by gender at Alliant International University-San Diego since 2012.
| Year | Total | Undergraduate | Graduate | ||||
|---|---|---|---|---|---|---|---|
| Total | Men | Women | Total | Men | Women | ||
| 2012-13 | 3,489 | 189 | 74 | 115 | 3,300 | 834 | 2,466 |
| 2013-14 | 4,201 712 | 917 728 | 402 328 | 515 400 | 3,284 -16 | 854 20 | 2,430 -36 |
| 2014-15 | 3,957 -244 | 975 58 | 474 72 | 501 -14 | 2,982 -302 | 824 -30 | 2,158 -272 |
| 2015-16 | 3,509 -448 | 944 -31 | 390 -84 | 554 53 | 2,565 -417 | 719 -105 | 1,846 -312 |
| 2016-17 | 4,003 494 | 1,471 527 | 647 257 | 824 270 | 2,532 -33 | 700 -19 | 1,832 -14 |
| 2017-18 | 3,780 -223 | 1,194 -277 | 602 -45 | 592 -232 | 2,586 54 | 764 64 | 1,822 -10 |
| 2018-19 | 3,780 0 | 988 -206 | 456 -146 | 532 -60 | 2,792 206 | 737 -27 | 2,055 233 |
| 2019-20 | 3,536 -244 | 631 -357 | 271 -185 | 360 -172 | 2,905 113 | 770 33 | 2,135 80 |
| 2020-21 | 3,429 -107 | 431 -200 | 178 -93 | 253 -107 | 2,998 93 | 732 -38 | 2,266 131 |
| 2021-22 | 3,662 233 | 378 -53 | 139 -39 | 239 -14 | 3,284 286 | 741 9 | 2,543 277 |
| 2022-23 | 3,599 -63 | 274 -104 | 93 -46 | 181 -58 | 3,325 41 | 740 -1 | 2,585 42 |
| Average | 3,722 | 763 | 339 | 424 | 2,959 | 765 | 2,194 |