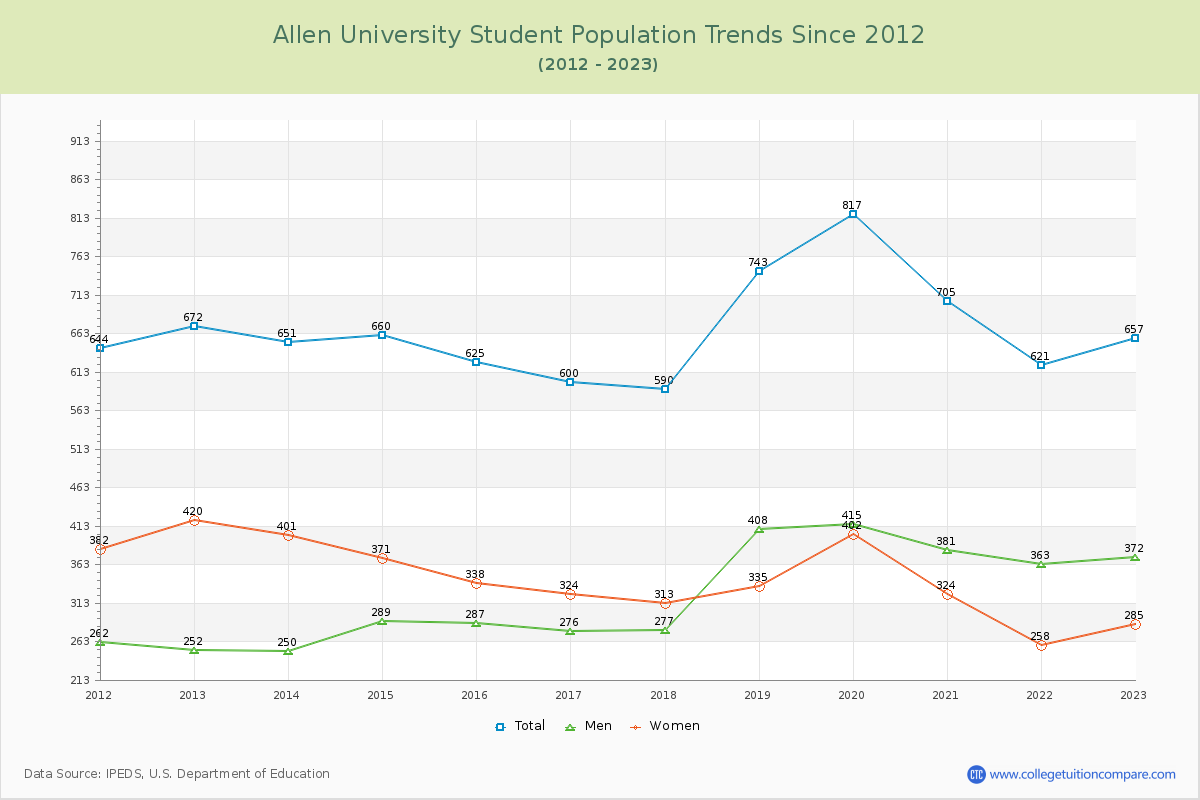
Student Population Changes
The average student population over the last 12 years is 667 where 657 students are attending the school for the academic year 2022-2023.
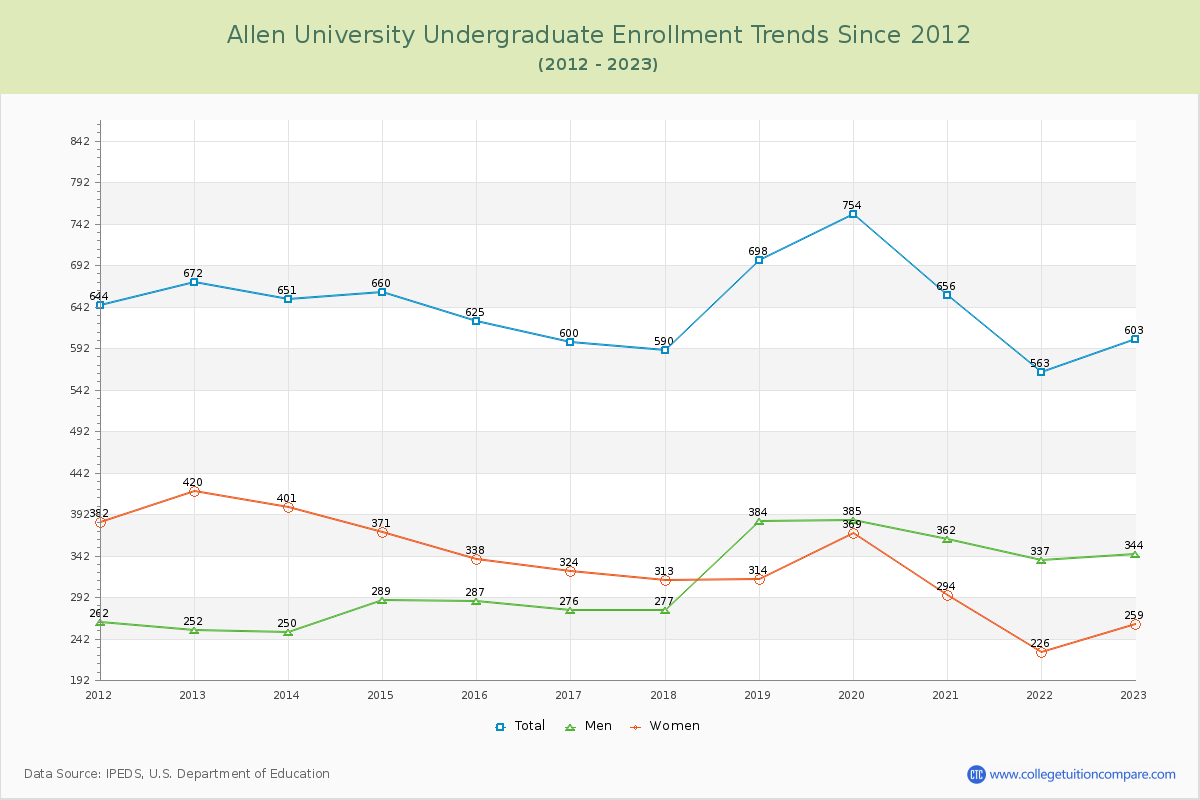
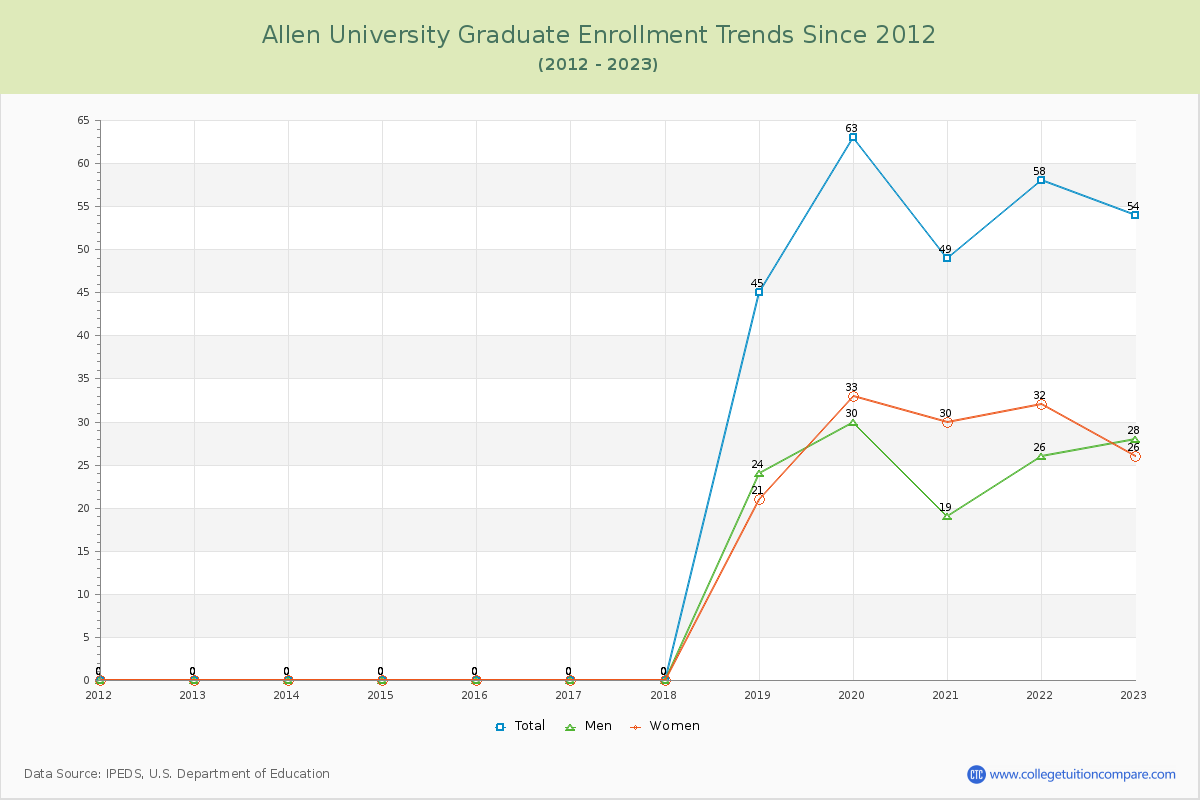
91.78% of total students is undergraduate students and 8.22% students is graduate students. The number of undergraduate students has decreased by 69 and the graduate enrollment has increased by 54 over past 10 years.
The female to male ratio is 0.77 to 1 and it means that there are more male students enrolled in Allen than female students.
The following table and chart illustrate the changes in student population by gender at Allen University since 2012.
| Year | Total | Undergraduate | Graduate | ||||
|---|---|---|---|---|---|---|---|
| Total | Men | Women | Total | Men | Women | ||
| 2012-13 | 672 | 672 | 252 | 420 | 0 | 0 | 0 |
| 2013-14 | 651 -21 | 651 -21 | 250 -2 | 401 -19 | 0 0 | 0 0 | 0 0 |
| 2014-15 | 660 9 | 660 9 | 289 39 | 371 -30 | 0 0 | 0 0 | 0 0 |
| 2015-16 | 625 -35 | 625 -35 | 287 -2 | 338 -33 | 0 0 | 0 0 | 0 0 |
| 2016-17 | 600 -25 | 600 -25 | 276 -11 | 324 -14 | 0 0 | 0 0 | 0 0 |
| 2017-18 | 590 -10 | 590 -10 | 277 1 | 313 -11 | 0 0 | 0 0 | 0 0 |
| 2018-19 | 743 153 | 698 108 | 384 107 | 314 1 | 45 45 | 24 24 | 21 21 |
| 2019-20 | 817 74 | 754 56 | 385 1 | 369 55 | 63 18 | 30 6 | 33 12 |
| 2020-21 | 705 -112 | 656 -98 | 362 -23 | 294 -75 | 49 -14 | 19 -11 | 30 -3 |
| 2021-22 | 621 -84 | 563 -93 | 337 -25 | 226 -68 | 58 9 | 26 7 | 32 2 |
| 2022-23 | 657 36 | 603 40 | 344 7 | 259 33 | 54 -4 | 28 2 | 26 -6 |
| Average | 667 | 643 | 313 | 330 | 24 | 12 | 13 |