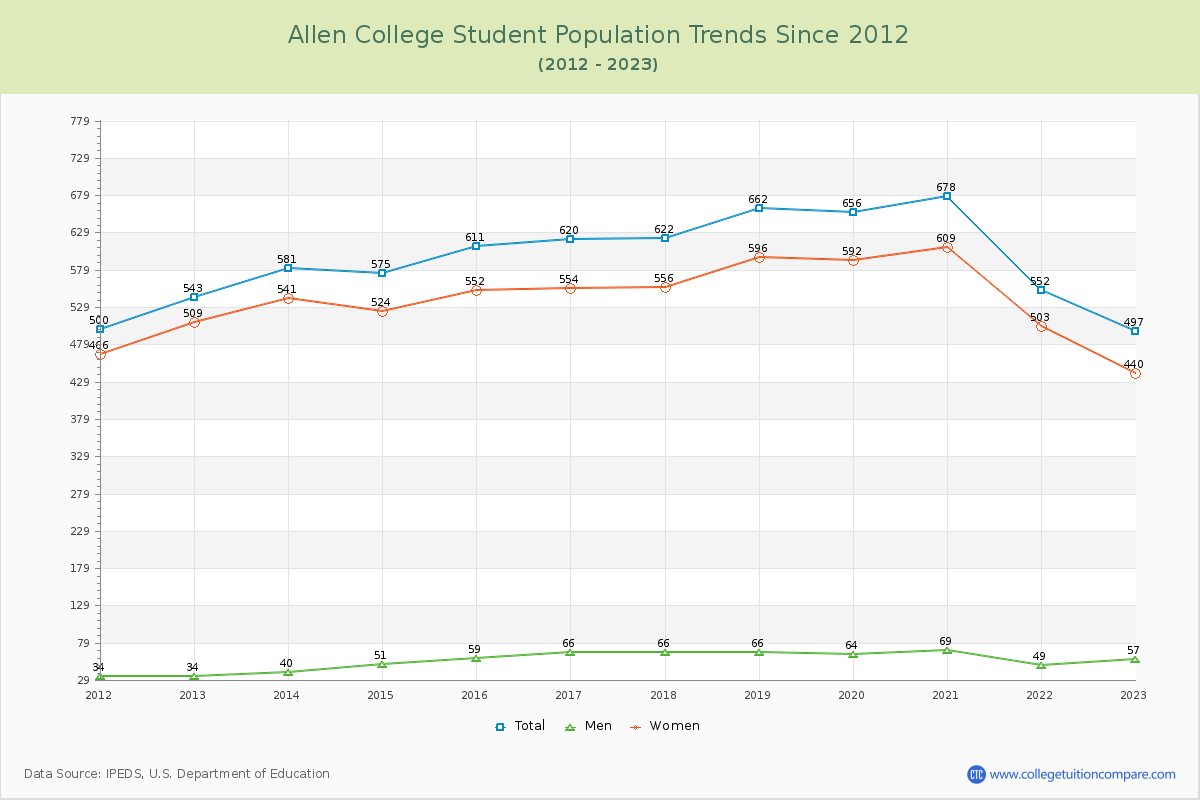
Student Population Changes
The average student population over the last 12 years is 600 where 497 students are attending the school for the academic year 2022-2023.
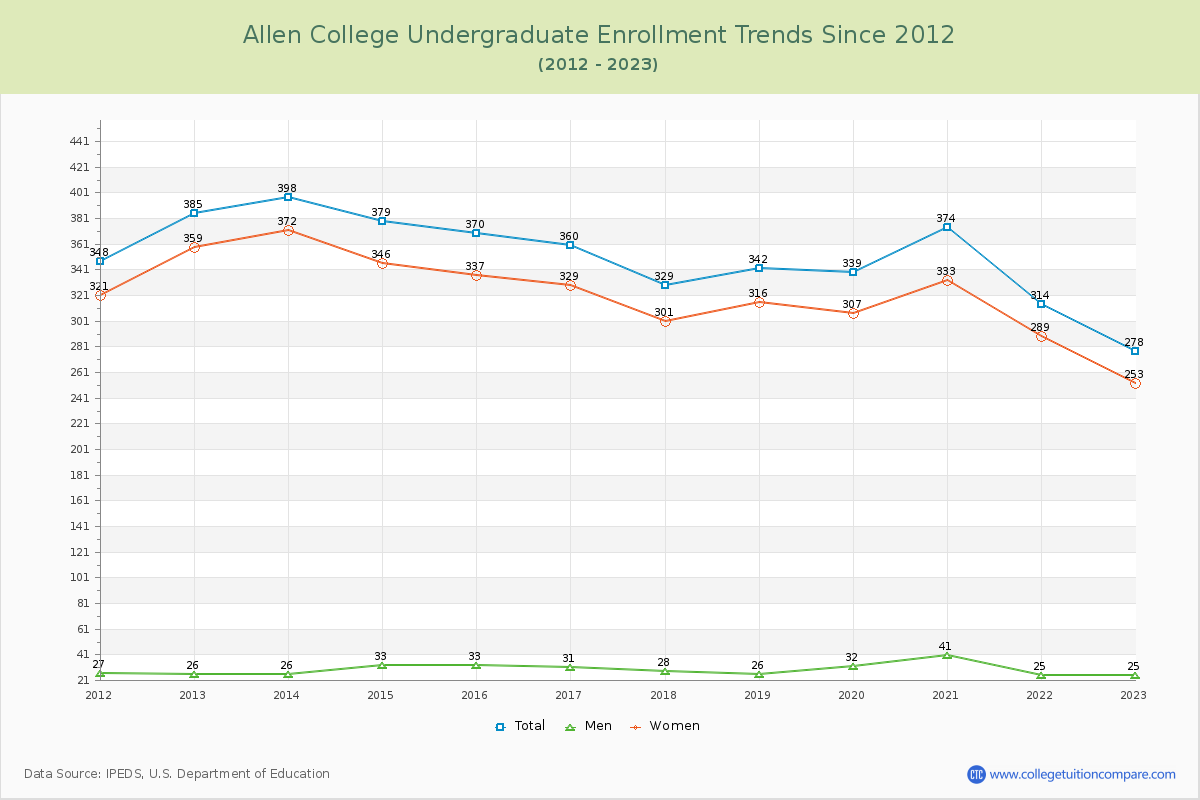
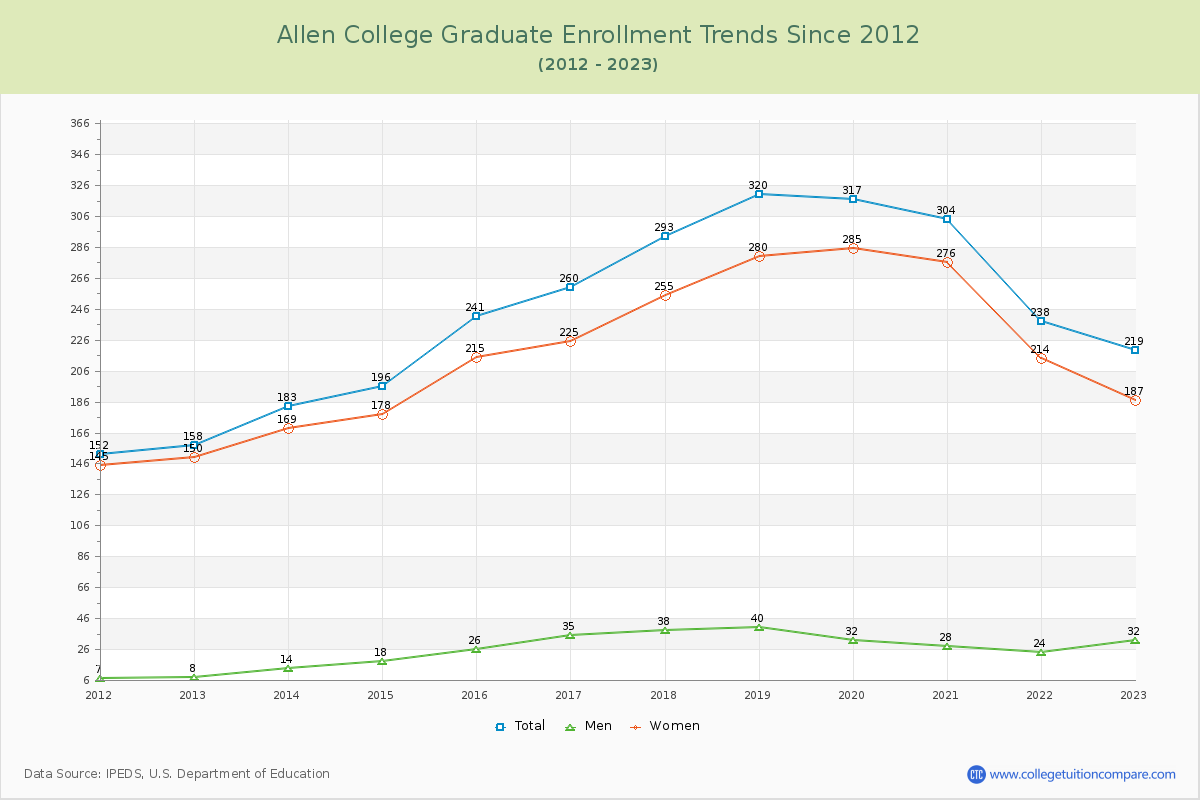
55.94% of total students is undergraduate students and 44.06% students is graduate students. The number of undergraduate students has decreased by 107 and the graduate enrollment has increased by 61 over past 10 years.
The female to male ratio is 7.72 to 1 and it means that there are far more female students enrolled in Allen than male students.
The following table and chart illustrate the changes in student population by gender at Allen College since 2012.
| Year | Total | Undergraduate | Graduate | ||||
|---|---|---|---|---|---|---|---|
| Total | Men | Women | Total | Men | Women | ||
| 2012-13 | 543 | 385 | 26 | 359 | 158 | 8 | 150 |
| 2013-14 | 581 38 | 398 13 | 26 0 | 372 13 | 183 25 | 14 6 | 169 19 |
| 2014-15 | 575 -6 | 379 -19 | 33 7 | 346 -26 | 196 13 | 18 4 | 178 9 |
| 2015-16 | 611 36 | 370 -9 | 33 0 | 337 -9 | 241 45 | 26 8 | 215 37 |
| 2016-17 | 620 9 | 360 -10 | 31 -2 | 329 -8 | 260 19 | 35 9 | 225 10 |
| 2017-18 | 622 2 | 329 -31 | 28 -3 | 301 -28 | 293 33 | 38 3 | 255 30 |
| 2018-19 | 662 40 | 342 13 | 26 -2 | 316 15 | 320 27 | 40 2 | 280 25 |
| 2019-20 | 656 -6 | 339 -3 | 32 6 | 307 -9 | 317 -3 | 32 -8 | 285 5 |
| 2020-21 | 678 22 | 374 35 | 41 9 | 333 26 | 304 -13 | 28 -4 | 276 -9 |
| 2021-22 | 552 -126 | 314 -60 | 25 -16 | 289 -44 | 238 -66 | 24 -4 | 214 -62 |
| 2022-23 | 497 -55 | 278 -36 | 25 0 | 253 -36 | 219 -19 | 32 8 | 187 -27 |
| Average | 600 | 352 | 30 | 322 | 248 | 27 | 221 |