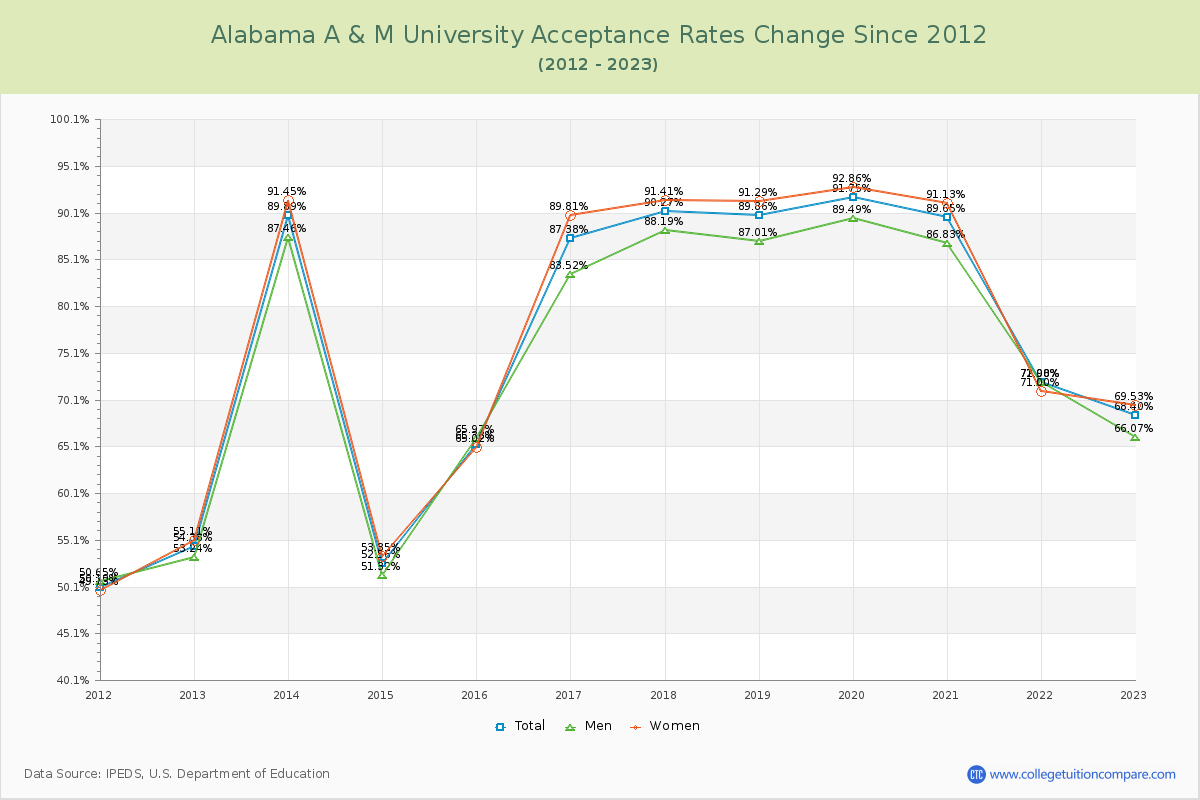
Acceptance Rate Changes
The average acceptance rate over the last 10 years is 77.41%, and this year's acceptance rate is 68.40% at Alabama A & M University. By gender, men students' acceptance rate is 75.55% and women students' rate is 78.36%. For 2023 admission, it was slightly harder to get into Alabama A & M University than the previous year. The acceptance rate at Alabama A & M University have not been tight and applicants have more chance to admit.
The next table and chart illustrate the acceptance rates changes at Alabama A & M University over the past 11 years (2012-2023).
| Year | Total | Men | Women |
|---|---|---|---|
| 2012-13 | 54.38% | 53.24% | 55.11% |
| 2013-14 | 89.89% 35.51% |
87.46% 36.34% |
91.45% 36.34% |
| 2014-15 | 52.56% -37.33% |
51.32% -38.10% |
53.35% -38.10% |
| 2015-16 | 65.38% 12.82% |
65.97% 11.67% |
65.02% 11.67% |
| 2016-17 | 87.38% 21.99% |
83.52% 24.79% |
89.81% 24.79% |
| 2017-18 | 90.27% 2.89% |
88.19% 1.60% |
91.41% 1.60% |
| 2018-19 | 89.86% -0.40% |
87.01% -0.13% |
91.29% -0.13% |
| 2019-20 | 91.75% 1.89% |
89.49% 1.58% |
92.86% 1.58% |
| 2020-21 | 89.65% -2.10% |
86.83% -1.73% |
91.13% -1.73% |
| 2021-22 | 72.00% -17.65% |
71.98% -20.13% |
71.00% -20.13% |
| 2022-23 | 68.40% -3.60% |
66.07% -1.47% |
69.53% -1.47% |
| Average | 77.41% | 75.55% | 78.36% |