Enrollment Trends at ATI

-218

Total Enrollment

-242

Men

24

Women

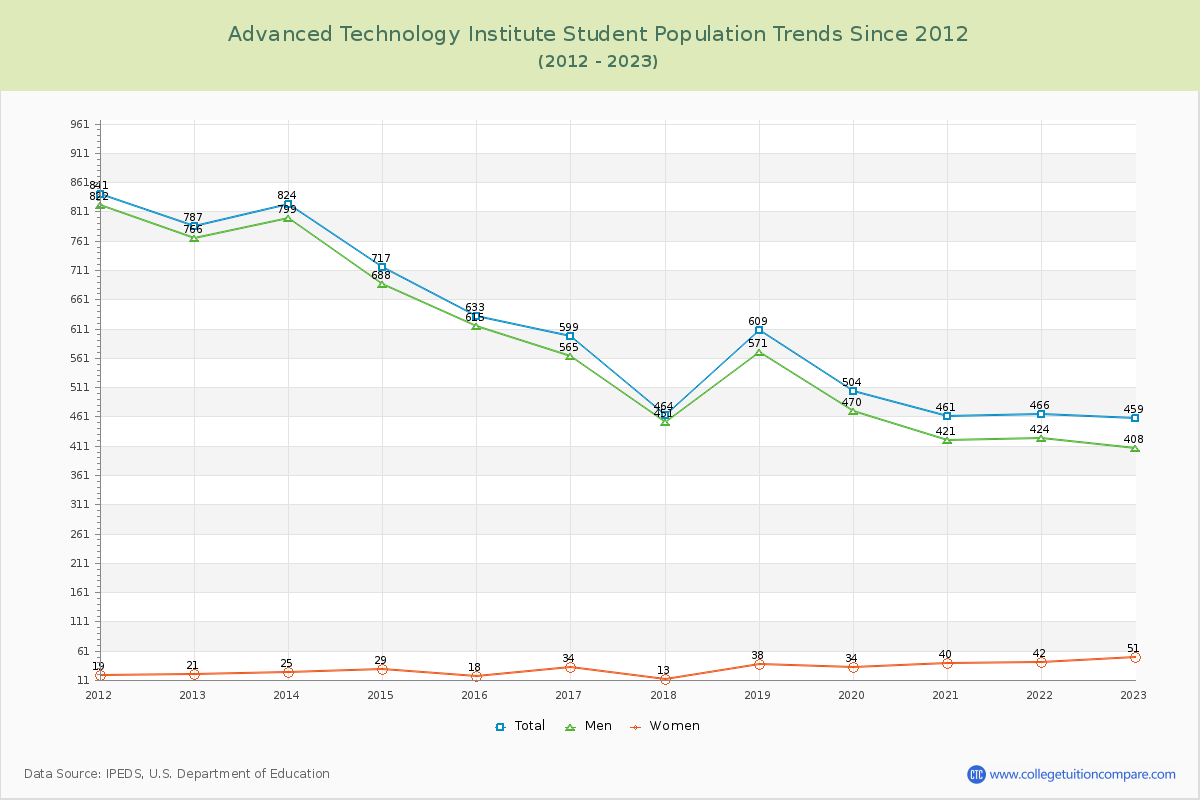
The student population at Advanced Technology Institute is 415 (all undergraduate). The number of students has decreased by 218 over the past decade.

The female to male ratio is 0.11 to 1 which means that majority of population is on male students.

All students have enrolled in on-campus classes (Advanced Technology Institute does not offer online degree/certificate program).

Student Population Changes

The average student population over the last 11 years is 499 where 415 students are attending the school for the academic year 2024-2025.

The female to male ratio is 0.11 to 1 and it means that there are far more male students enrolled in ATI than female students.

The following table and chart illustrate the changes in student population by gender at Advanced Technology Institute since 2015.

YearTotalMenWomen
2015-1663361518
2016-17599
-34
565
-50
34
16
2017-18464
-135
451
-114
13
-21
2018-19609
145
571
120
38
25
2019-20504
-105
470
-101
34
-4
2020-21461
-43
421
-49
40
6
2021-22466
5
424
3
42
2
2022-23459
-7
408
-16
51
9
2023-24377
-82
341
-67
36
-15
2024-25415
38
373
32
42
6
Average49946435
Advanced Technology Institute Enrollment Trends Chart

Enrollment by Race/Ethnicity Changes

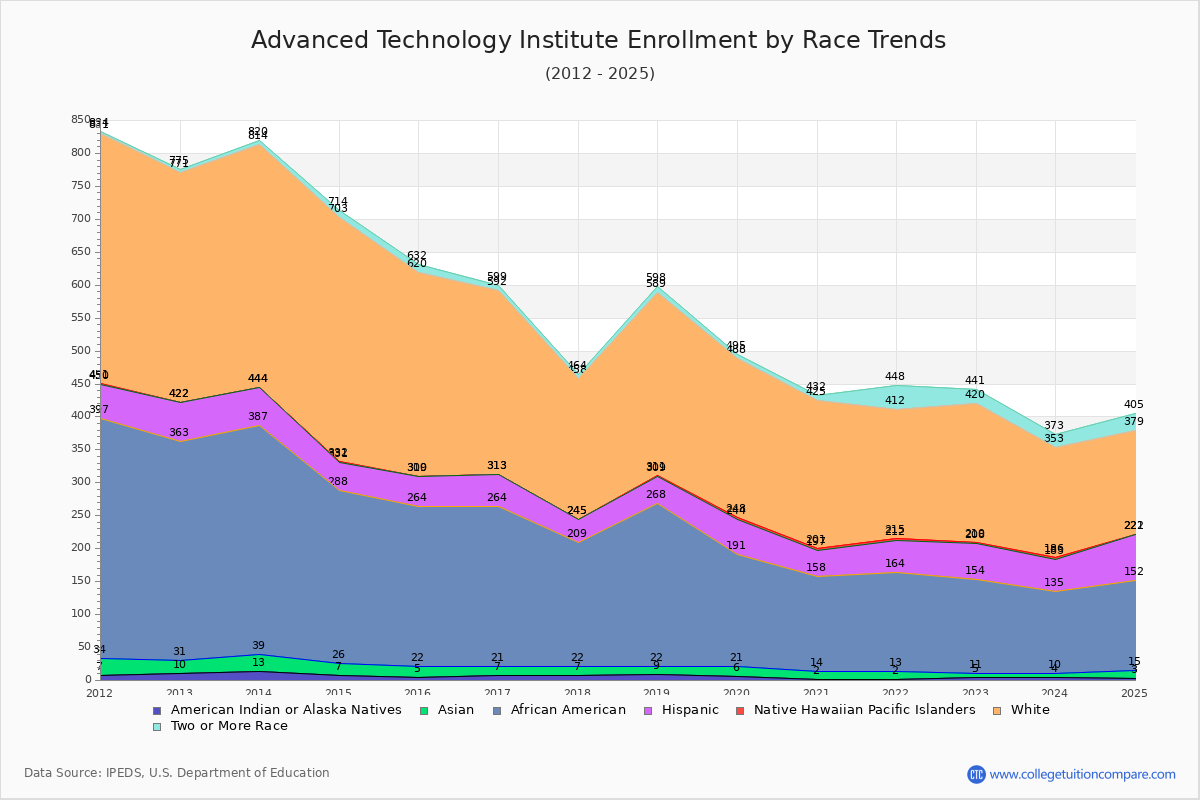
The percentage of white students is 37.83% and the percentage of black students is 33.01% at Advanced Technology Institute. 2.89% of enrolled students is Asian. Hispanic students comprise 16.63% of the student body.

Over the past 10 years, the racial composition has shifted. The percentage of white students decreased from 48.97% to 37.83%. Asian enrollment grew from 2.69% to 2.89%. Black student enrollment decreased from 38.23% to 33.01%. Hispanic student representation expanded from 7.11% to 16.63%.

The overall racial diversity, measured by the Census Bureau Diversity Index, is 0.7154 which indicates that quite diverse. This increased from 0.6078 a decade ago, suggesting that racial diversity has improved.

The following table and chart illustrate the student population trends by race/ethnicity at Advanced Technology Institute over the past 11 years (2015-2025).

YearAmerican Indian or Native AmericanAsianBlackHispanicNative Hawaiian or Other Pacific IslanderWhiteTwo or More Races
2015-1651724245131012
2016-177142434902797
2017-187151873602136
2018-199132464122789
2019-206151705342407
2020-212121443942247
2021-2221115148319736
2022-235614354221021
2023-244612548316720
2024-2531213769115726
Average51217948222815
Advanced Technology Institute Enrollment by Race Trends Chart

Distance Learning (Online Courses) Enrollment Changes

Advanced Technology Institute does not offer online degree/certificate programs. All Students have enrolled in on-campus programs.


Ratings & Review

Share your experiences and thoughts about Advanced Technology Institute. It will be a great help to applicants and prospective students!