Acceptance Rate Trends
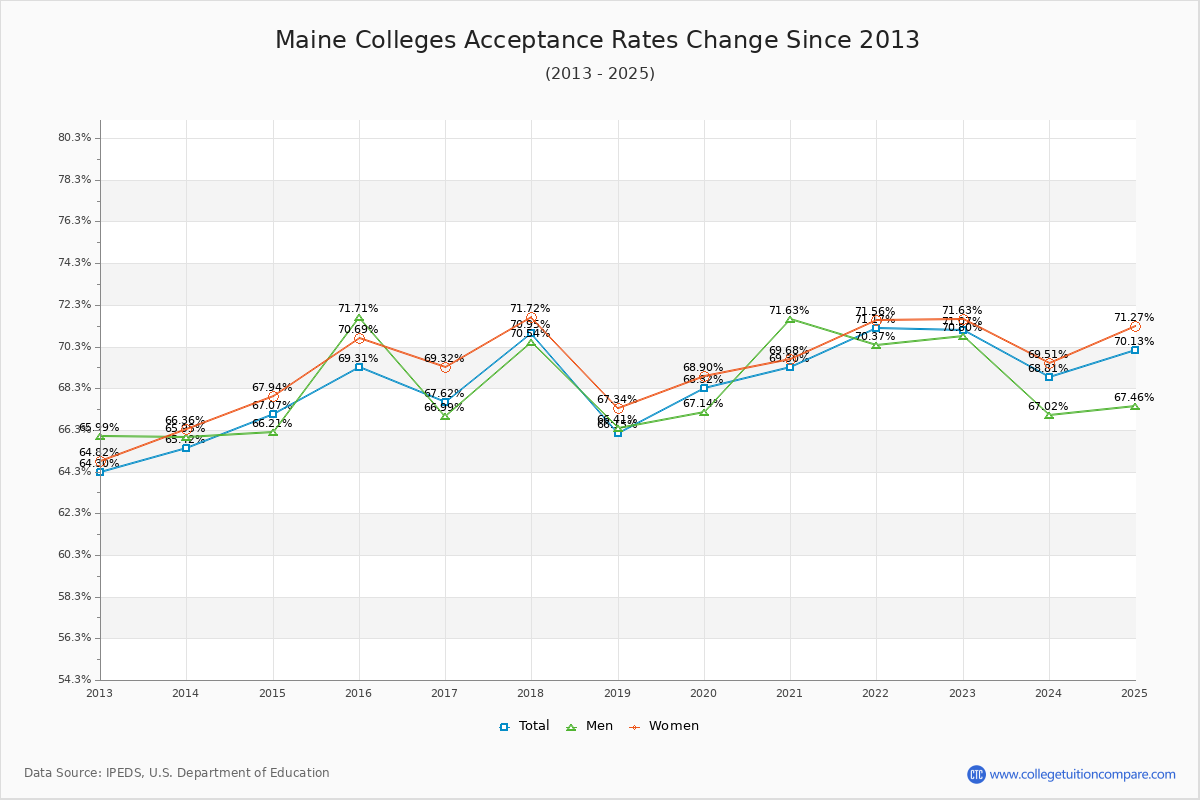
The average acceptance rate over the last 10 years is 69.08% where the current academic year rate is 70.13% at Maine Colleges. By gender, men students' acceptance rate is 68.75% and women students' rate is 69.96%.
The following table and chart illustrate the acceptance rates changes at Maine Colleges over the past 11 years (2014-2025).
| Year | Total | Men | Women |
| 2014-15 |
67.07% |
66.21% |
67.94% |
|---|
| 2015-16 |
69.31% 2.24% |
71.71% 5.49% |
70.69% 2.74% |
|---|
| 2016-17 |
67.62% -1.70% |
66.99% -4.72% |
69.32% -1.37% |
|---|
| 2017-18 |
70.95% 3.34% |
70.54% 3.55% |
71.72% 2.40% |
|---|
| 2018-19 |
66.15% -4.81% |
66.41% -4.13% |
67.34% -4.39% |
|---|
| 2019-20 |
68.32% 2.17% |
67.14% 0.74% |
68.90% 1.56% |
|---|
| 2020-21 |
69.30% 0.98% |
71.63% 4.48% |
69.68% 0.78% |
|---|
| 2021-22 |
71.17% 1.87% |
70.37% -1.25% |
71.56% 1.88% |
|---|
| 2022-23 |
71.07% -0.09% |
70.80% 0.43% |
71.63% 0.06% |
|---|
| 2023-24 |
68.81% -2.26% |
67.02% -3.78% |
69.51% -2.11% |
|---|
| 2024-25 |
70.13% 1.32% |
67.46% 0.44% |
71.27% 1.76% |
|---|
| Average |
69.08% |
68.75% |
69.96% |
|---|
Admission Yield (Enrollment Rate) Changes
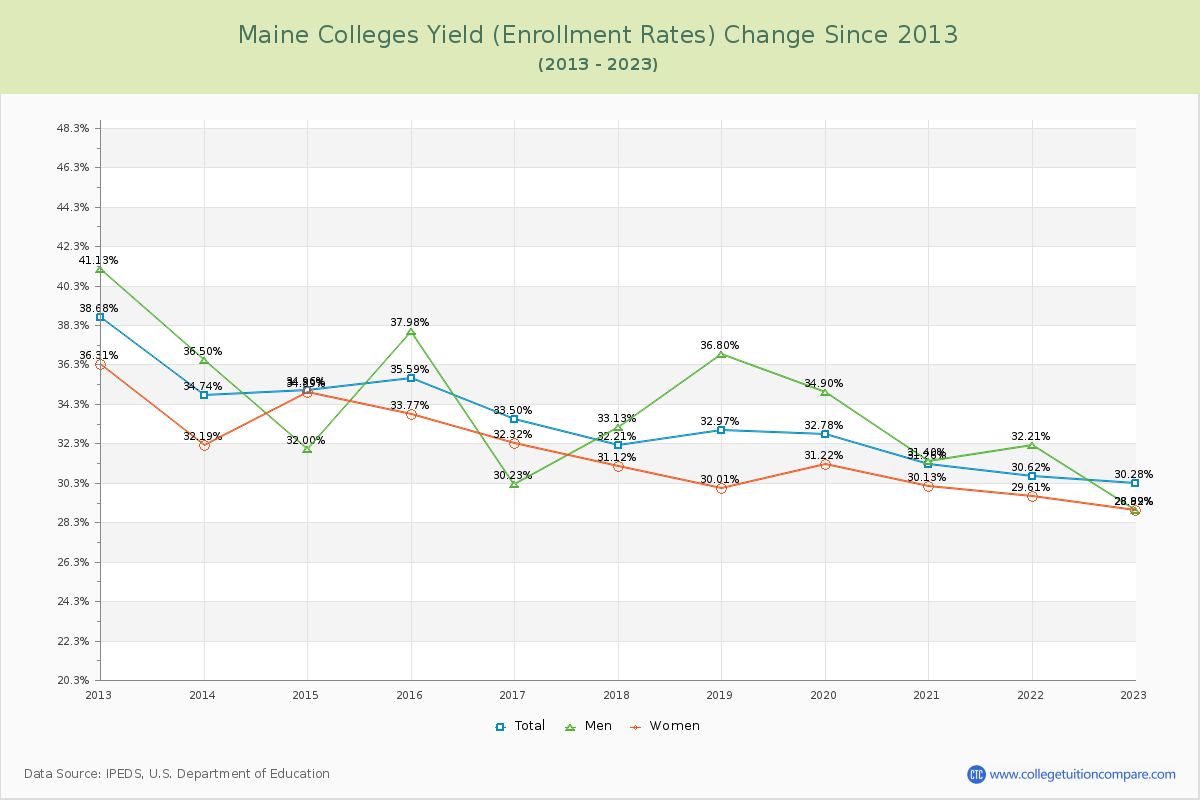
The average admission yield of the last 12 years is 31.98% where the current academic year yield is 28.41%. The yield, also known as enrollment rate is the percentage of admitted students who finally enrolled. The following table and chart illustrate the changes in yield at Maine Colleges from 2014 to 2025.
| Year | Total | Men | Women |
| 2014-15 |
34.96% |
32.00% |
34.89% |
|---|
| 2015-16 |
35.59% 0.63% |
37.98% 5.99% |
33.77% -1.12% |
|---|
| 2016-17 |
33.50% -2.09% |
30.23% -7.76% |
32.32% -1.45% |
|---|
| 2017-18 |
32.21% -1.29% |
33.13% 2.91% |
31.12% -1.19% |
|---|
| 2018-19 |
32.97% 0.76% |
36.80% 3.67% |
30.01% -1.11% |
|---|
| 2019-20 |
32.78% -0.19% |
34.90% -1.90% |
31.22% 1.21% |
|---|
| 2020-21 |
31.26% -1.52% |
31.40% -3.50% |
30.13% -1.09% |
|---|
| 2021-22 |
30.62% -0.64% |
32.21% 0.81% |
29.61% -0.52% |
|---|
| 2022-23 |
30.28% -0.34% |
28.89% -3.32% |
28.92% -0.69% |
|---|
| 2023-24 |
29.15% -1.13% |
30.07% 1.19% |
27.87% -1.06% |
|---|
| 2024-25 |
28.41% -0.74% |
24.92% -5.15% |
27.37% -0.49% |
|---|
| Average |
31.98% |
32.05% |
30.66% |
|---|
Applicants, Admitted, and Enrolled Headcount Changes
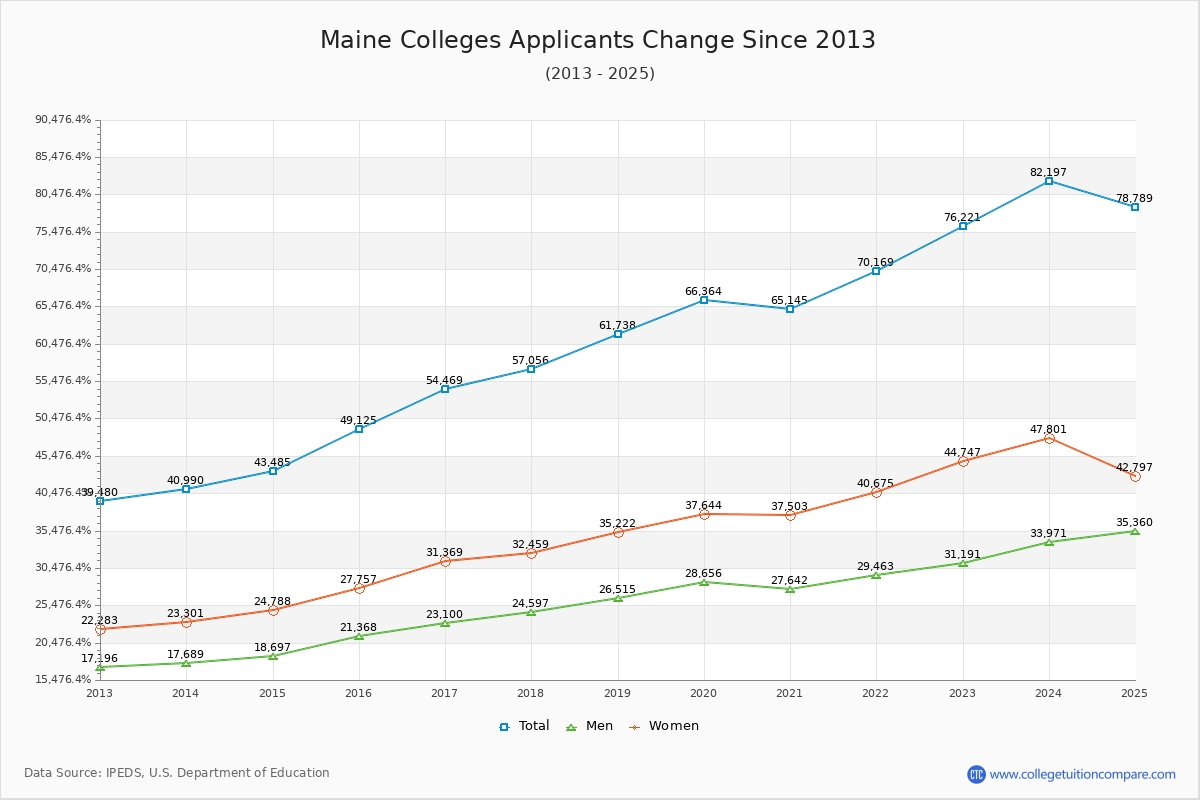
The average number of applicants is 64,069, the average number of admitted is 34,046, and the average number of enrolled students is 7,350 over the last 10 years.
The number of applicants to Maine Colleges decreased by -4.15% (3,408 applicants) compared to last year.
The following table and chart show the changes of applicants, admitted, and enrolled headcount at Maine Colleges from 2014 to 2025.
| Year | Applicants | Admitted | Enrolled |
|---|
| 2014-15 |
43,485 |
25,586 |
6,545 |
|---|
| 2015-16 |
49,125 12.97% |
29,124 13.83% |
7,354 12.36% |
|---|
| 2016-17 |
54,469 10.88% |
31,609 8.53% |
7,603 3.39% |
|---|
| 2017-18 |
57,056 4.75% |
32,824 3.84% |
7,653 0.66% |
|---|
| 2018-19 |
61,738 8.21% |
31,762 -3.24% |
7,726 0.95% |
|---|
| 2019-20 |
66,364 7.49% |
33,156 4.39% |
7,684 -0.54% |
|---|
| 2020-21 |
65,145 -1.84% |
33,643 1.47% |
7,007 -8.81% |
|---|
| 2021-22 |
70,169 7.71% |
37,585 11.72% |
7,575 8.11% |
|---|
| 2022-23 |
76,221 8.62% |
41,211 9.65% |
7,432 -1.89% |
|---|
| 2023-24 |
82,197 7.84% |
42,132 2.23% |
7,442 0.13% |
|---|
| 2024-25 |
78,789 -4.15% |
35,871 -14.86% |
6,826 -8.28% |
|---|
| Average |
64,069 |
34,046 |
7,350 |
|---|