Enrollment Trends at A T Still University of Health Sciences

109

Total Enrollment

-311

Men

420

Women

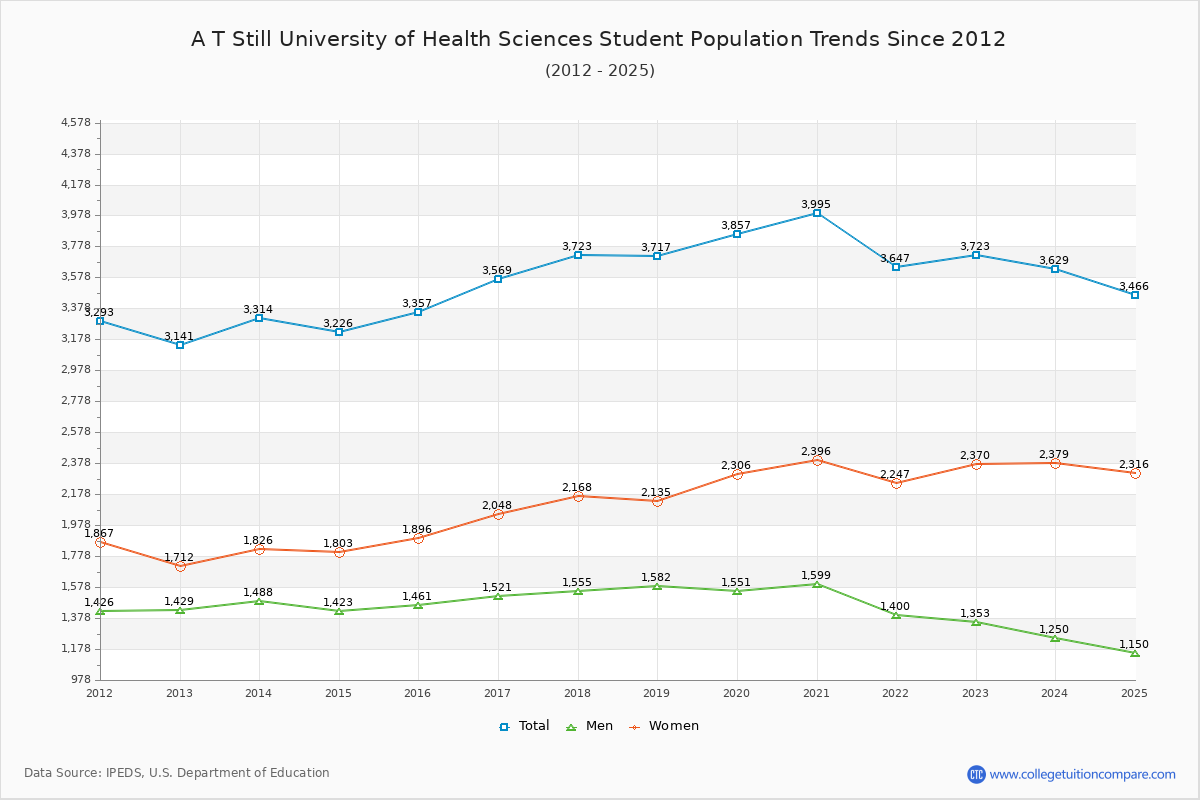
The student population at A T Still University of Health Sciences is 3,466 (all graduate). The number of students has increased by 109 over the past decade.

The female to male ratio is 2.01 to 1 which means that majority of population is on female students.

930 students enrolled in online degree program exclusively and the number of online students has decreased by -26.83% since 2015.

Student Population Changes

The average student population over the last 11 years is 3,668 where 3,466 students are attending the school for the academic year 2024-2025.

The female to male ratio is 2.01 to 1 and it means that there are far more female students enrolled in A T Still University of Health Sciences than male students.

The following table and chart illustrate the changes in student population by gender at A T Still University of Health Sciences since 2015.

YearTotalMenWomen
2015-163,3571,4611,896
2016-173,569
212
1,521
60
2,048
152
2017-183,723
154
1,555
34
2,168
120
2018-193,717
-6
1,582
27
2,135
-33
2019-203,857
140
1,551
-31
2,306
171
2020-213,995
138
1,599
48
2,396
90
2021-223,647
-348
1,400
-199
2,247
-149
2022-233,723
76
1,353
-47
2,370
123
2023-243,629
-94
1,250
-103
2,379
9
2024-253,466
-163
1,150
-100
2,316
-63
Average3,6681,4422,226
A T Still University of Health Sciences Enrollment Trends Chart

Enrollment by Race/Ethnicity Changes

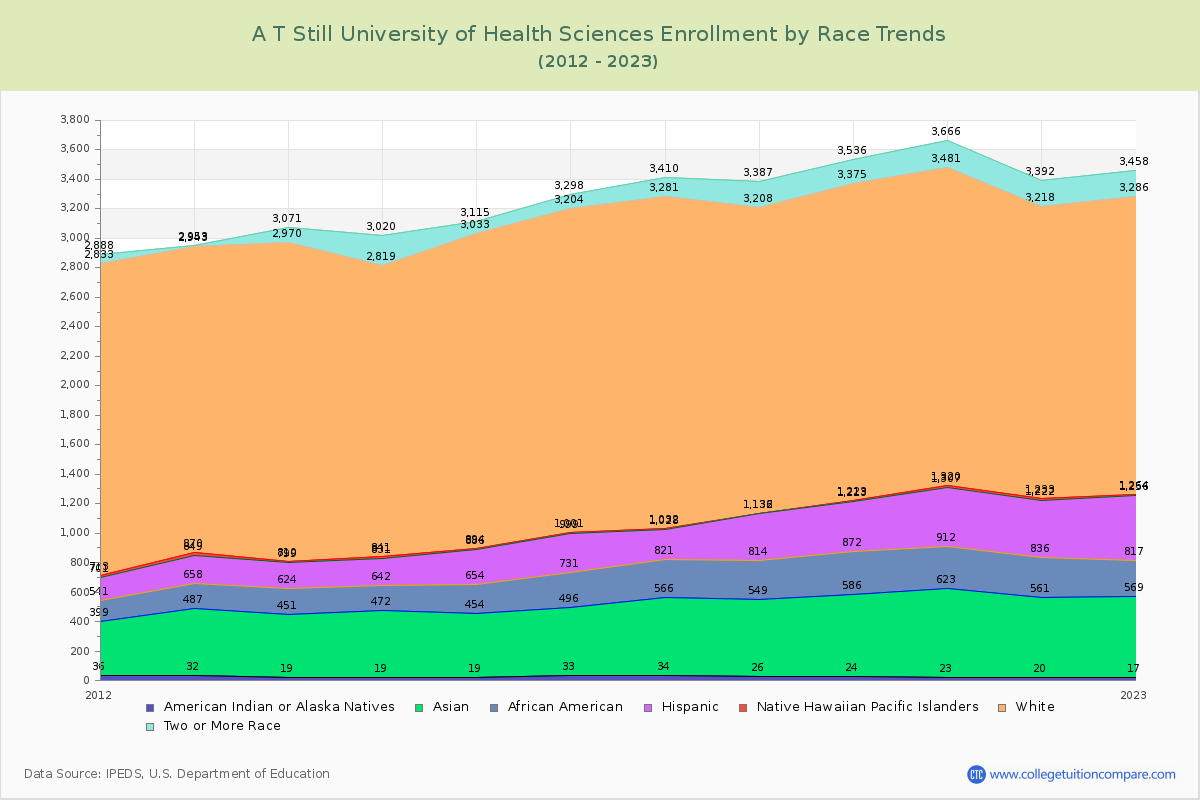
The percentage of white students is 51.24%. The percentage was 63.72% 10 years ago and A T Still University of Health Sciences still has a high percentage of white students. 15.38% of enrolled students is Asian and 7.27% is black students. Hispanic students comprise 12.81% of the student body.

Over the past 10 years, the racial composition has shifted. The percentage of white students decreased from 63.72% to 51.24%. Asian enrollment grew from 12.96% to 15.38%. Black student enrollment increased from 5.96% to 7.27%. Hispanic student representation expanded from 6.91% to 12.81%.

The overall racial diversity, measured by the Census Bureau Diversity Index, is 0.6890 which indicates that moderately diverse. This increased from 0.5683 a decade ago, suggesting that racial diversity has improved.

The following table and chart illustrate the student population trends by race/ethnicity at A T Still University of Health Sciences over the past 11 years (2015-2025).

YearAmerican Indian or Native AmericanAsianBlackHispanicNative Hawaiian or Other Pacific IslanderWhiteTwo or More Races
2015-161943520023282,13982
2016-173346323526822,20394
2017-183453225520742,249129
2018-192652326531842,072179
2019-2024562286341102,152161
2020-2123600289395132,161185
2021-2220541275386111,985174
2022-231755224843982,022172
2023-241752524745061,955177
2024-251853325244471,776193
Average2352725534872,071155
A T Still University of Health Sciences Enrollment by Race Trends Chart

Distance Learning (Online Courses) Enrollment Changes

930 students are enrolled in online degree programs exclusively for the academic year 2024-2025, which is 27% of total students. The number of online students has decreased -26.83% since 2015. The following table and chart illustrate the changes in the online student population by enrolled type at A T Still University of Health Sciences from 2015 to 2025.

YearTotal EnrollmentOnline CompletelyEnrolled in Some Online CoursesNot Enrolled in Online Courses
2015-163,3571,27102,086
2016-173,5691,4212,1480
2017-183,7231,56502,158
2018-193,7171,53202,185
2019-203,8571,6042,2530
2020-213,9951,6512,3440
2021-223,6471,2572,3900
2022-233,7231,1682,5550
2023-243,6291,0742,5550
2024-253,4669302,5360
Average3,6681,3471,678643

Ratings & Review

Share your experiences and thoughts about A T Still University of Health Sciences. It will be a great help to applicants and prospective students!