How many students at The Chicago School at San Diego? For the academic year 2024-2025, a total of 112 students have enrolled in The Chicago School at San Diego and all students are attending graduate schools.
By gender, 27 male and 85 female students are attending the school.
It has much fewer students compared to similar colleges (627 students on average - private (not-for-profit) Other health professions school).
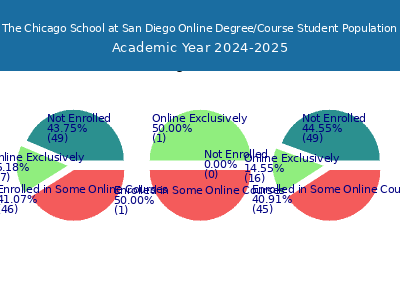
17 students are enrolled exclusively, and 46 students are enrolled in some online courses.
You can check the student demographics by gender ratio, race/ethnicity, age distribution, and online enrollment.
Student Population by Gender
The Chicago School at San Diego has a total of 112 enrolled students for the academic year 2024-2025. 2 students have enrolled in undergraduate programs and 110 students joined graduate programs.
By gender, 27 male and 85 female students (the male-female ratio is 24:76) are attending the school.
Total Student Enrolled By Gender
| Graduate |
|---|
| Total | 110 |
|---|
| Men | 27 |
|---|
| Women | 83 |
|---|
Student Distribution by Race/Ethnicity
By race/ethnicity, 44 White, 10 Black, and 15 Asian students out of a total of 112 are attending at The Chicago School at San Diego. Comprehensive enrollment statistic data by race/ethnicity is shown in the chart below (academic year 2024-2025 data).
The Chicago School at San Diego is quite diverse with a diversity index of 72.9% measured by Census Bureau Diversity Index. The institution demonstrates strong racial and ethnic diversity among its student body.
Race/Ethnicity Distribution (Total)
| Race | Total | Men | Women |
| American Indian or Native American | - | - | - |
|---|
| Asian | 15 | 3 | 12 |
|---|
| Black | 10 | 3 | 7 |
|---|
| Hispanic | 33 | 7 | 26 |
|---|
| Native Hawaiian or Other Pacific Islanders | - | - | - |
|---|
| White | 44 | 13 | 31 |
|---|
| Two or more races | 2 | 0 | 2 |
|---|
| Race Unknown | 7 | 0 | 7 |
|---|
Race/Ethnicity Distribution (Undergraduate)
| Race | Total | Men | Women |
| American Indian or Native American | - | - | - |
|---|
| Asian | - | - | - |
|---|
| Black | - | - | - |
|---|
| Hispanic | 1 | 0 | 1 |
|---|
| Native Hawaiian or Other Pacific Islanders | - | - | - |
|---|
| White | - | - | - |
|---|
| Two or more races | - | - | - |
|---|
| Race Unknown | 1 | 0 | 1 |
|---|
Race/Ethnicity Distribution (Graduate)
| Race | Total | Men | Women |
| American Indian or Native American | - | - | - |
|---|
| Asian | 15 | 3 | 12 |
|---|
| Black | 10 | 3 | 7 |
|---|
| Hispanic | 32 | 7 | 25 |
|---|
| Native Hawaiian or Other Pacific Islanders | - | - | - |
|---|
| White | 44 | 13 | 31 |
|---|
| Two or more races | 2 | 0 | 2 |
|---|
| Race Unknown | 6 | 0 | 6 |
|---|
Student Age Distribution
There are 28 students under 25 years old, and 113 students over 25 years old out of 141 total students.
The Chicago School at San Diego has 2 undergraduate students aged under 25 and 3 students aged 25 and over.
It has 26 graduate students aged under 25 and 110 students aged 25 and over.
*The age distribution is based on 2023-2024 enrollment data.
Student Age Distribution (Total)
| Age | Total | Men | Women |
| 20-21 | 1 | 1 | 0 |
|---|
| 22-24 | 27 | 24 | 3 |
|---|
| 25-29 | 43 | 34 | 9 |
|---|
| 30-34 | 29 | 21 | 8 |
|---|
| 35-39 | 19 | 12 | 7 |
|---|
| 40-49 | 15 | 11 | 4 |
|---|
| 50-64 | 5 | 5 | 0 |
|---|
| Over 65 | 2 | 2 | 0 |
|---|
Student Age Distribution (Undergraduate)
| Age | Total | Men | Women |
| 20-21 | 1 | 1 | 0 |
|---|
| 22-24 | 1 | 1 | 0 |
|---|
| 30-34 | 2 | 1 | 1 |
|---|
| 50-64 | 1 | 1 | 0 |
|---|
Student Age Distribution (Graduate)
| Age | Total | Men | Women |
| 22-24 | 26 | 23 | 3 |
|---|
| 25-29 | 43 | 34 | 9 |
|---|
| 30-34 | 27 | 20 | 7 |
|---|
| 35-39 | 19 | 12 | 7 |
|---|
| 40-49 | 15 | 11 | 4 |
|---|
| 50-64 | 4 | 4 | 0 |
|---|
| Over 65 | 2 | 2 | 0 |
|---|
Online Student Enrollment
Distance learning, also called online education, is very attractive to students, especially those who want to continue education and work in the field. At The Chicago School at San Diego, 17 students are enrolled exclusively in online courses and 46 students are enrolled in some online courses.
16 students who live in California or the jurisdiction in which the school is located are enrolled exclusively in online courses and 1 students live in another State or outside of the United States.
Online Student Population
| All Students | Enrolled Exclusively Online Courses | Enrolled in Some Online Courses |
|---|
| All Students | 112 | 17 | 46 |
|---|
| Undergraduate | 2 | 1 | 1 |
|---|
| Graduate | 110 | 16 | 45 |
|---|
Online Student Population by Locality
| California Residents | Other States in U.S. | Outside of U.S. |
|---|
| All Students | 16 | - | 1 |
|---|
| Undergraduate | 1 | - | 0 |
|---|
| Graduate | 15 | - | 1 |
|---|
The Chicago School at San Diego Enrollment Frequently Asked Questions
For the academic year 2024-2025, 112 students are enrolled at The Chicago School at San Diego.
2 undergraduate and 110 graduate students are enrolled at The Chicago School at San Diego.
27 male (24.11%) and 85 female (75.89%) students are attending The Chicago School at San Diego.
1 international students (0.89%) are enrolled at The Chicago School at San Diego.
The Chicago School at San Diego has a student population that is quite diverse with no single group in majority: 44 White (39.29%), 10 Black (8.93%), and 15 Asian (13.39%) students are enrolled.
17 students are enrolled exclusively online, and 46 students take some online courses.