Student Population by Gender

West Coast University-Center for Graduate Studies has a total of 591 enrolled students for the academic year 2022-2023. All 591 students are enrolled into graduate programs.
By gender, 192 male and 399 female students (the male-female ratio is 32:68) are attending the school. The gender distribution is based on the 2022-2023 data.
Total Student Enrolled By Gender
Graduate
Total591
Men192
Women399
West Coast University-Center for Graduate Studies 2023 Student Population by Gender and Race chart

Student Distribution by Race/Ethnicity

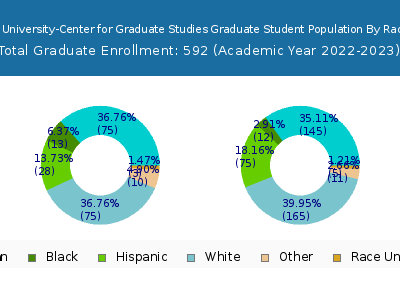
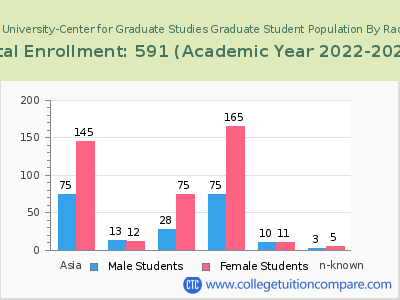
By race/ethnicity, 210 White, 25 Black, and 190 Asian students out of a total of 591 are attending at West Coast University-Center for Graduate Studies. Comprehensive enrollment statistic data by race/ethnicity is shown in the next chart (Academic year 2022-2023 data).
West Coast University-Center for Graduate Studies 2023 Student Population by Gender and Race chart
Race/Ethnicity Distribution
RaceTotalMenWomen
American Indian or Native American110
Asian19059131
Black251411
Hispanic1252798
Native Hawaiian or Other Pacific Islanders000
White21074136
Two or more races311516
Race Unknown404

Student Age Distribution

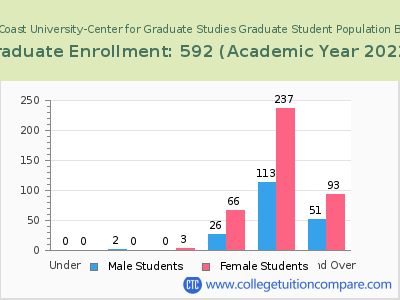
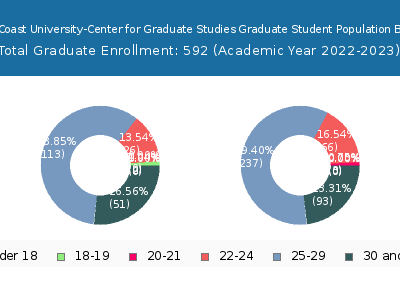
There are 97 students under 25 years old, and 494 students over 25 years old out of 591 total students.
West Coast University-Center for Graduate Studies 2023 Student Population by Age chartWest Coast University-Center for Graduate Studies 2023 Student Population Age Diversity Pie chart
Student Age Distribution
AgeTotalMenWomen

Compare West Coast University-Center for Graduate Studies in a Variety of Ways

Related Articles and Ads