Student Population by Gender
Alhambra Medical University has a total of 143 enrolled students for the academic year 2022-2023. 48 students have enrolled in undergraduate programs and 95 students joined graduate programs.
By gender, 37 male and 106 female students (the male-female ratio is 26:74) are attending the school. The gender distribution is based on the 2022-2023 data.
| Graduate | |
|---|---|
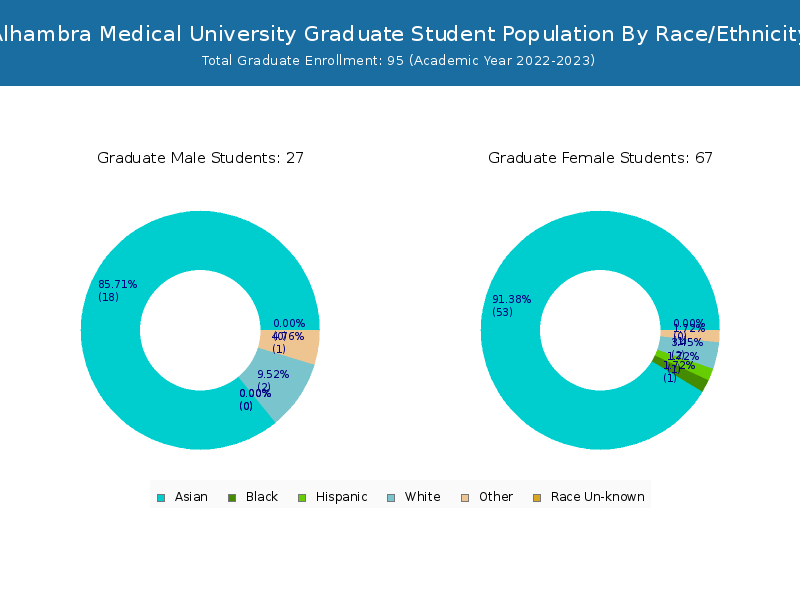
| Total | 95 |
| Men | 24 |
| Women | 71 |
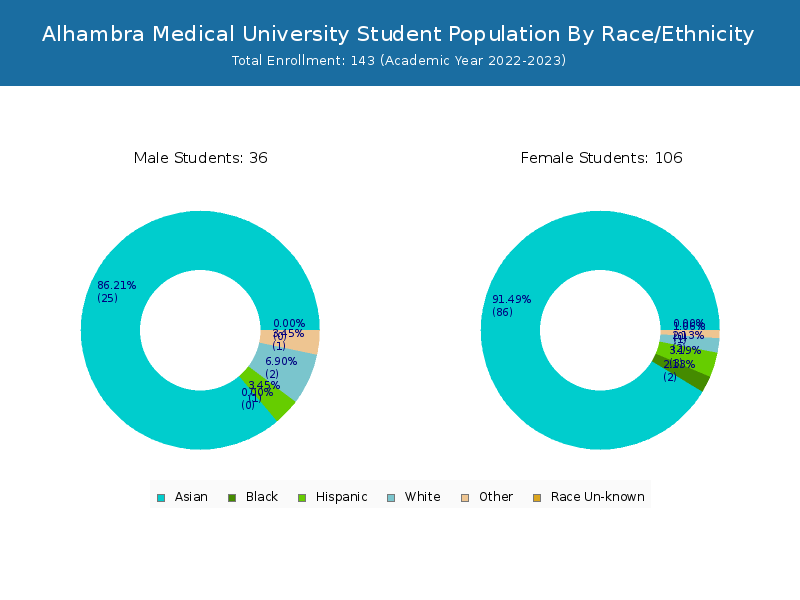
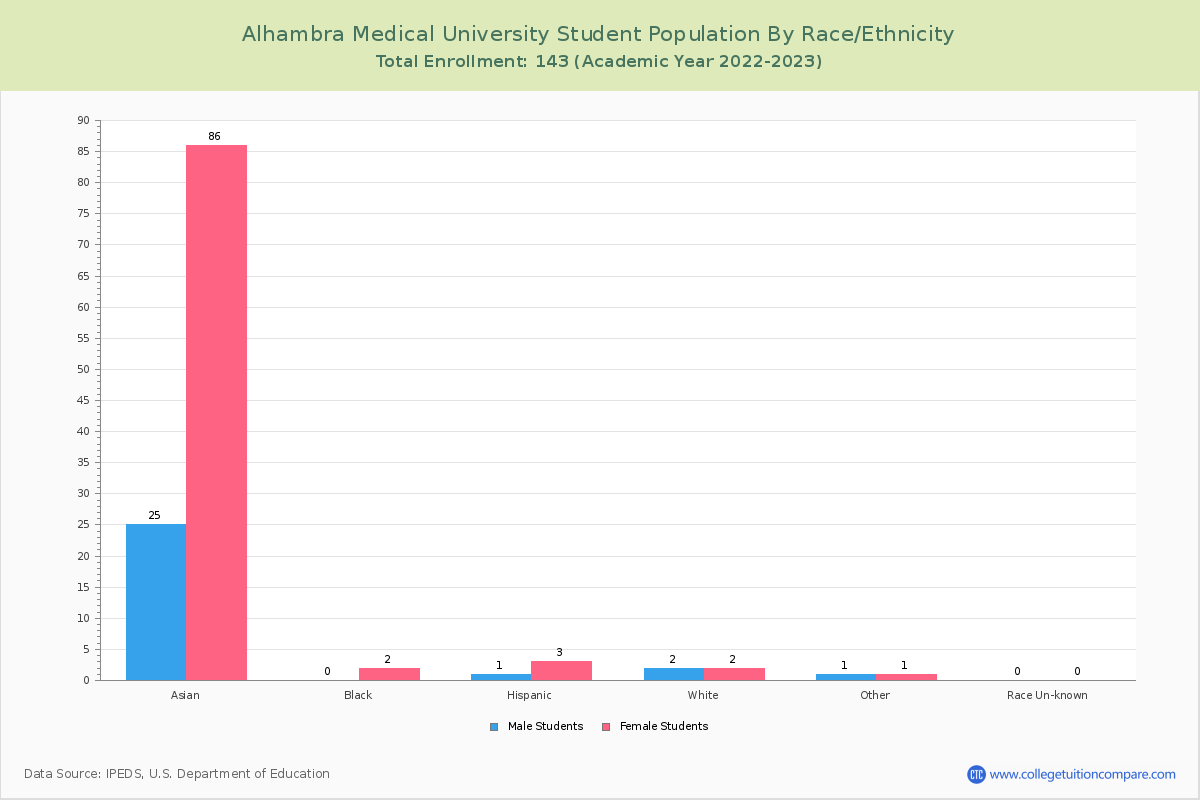
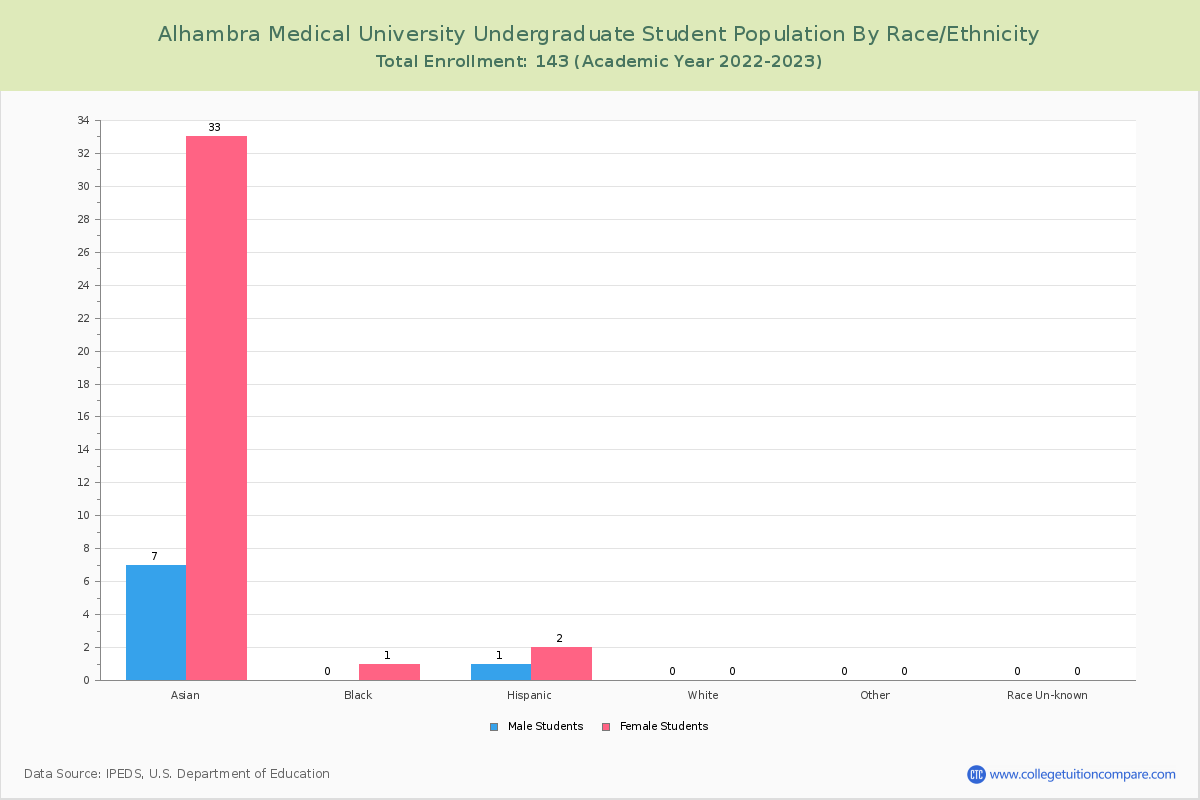
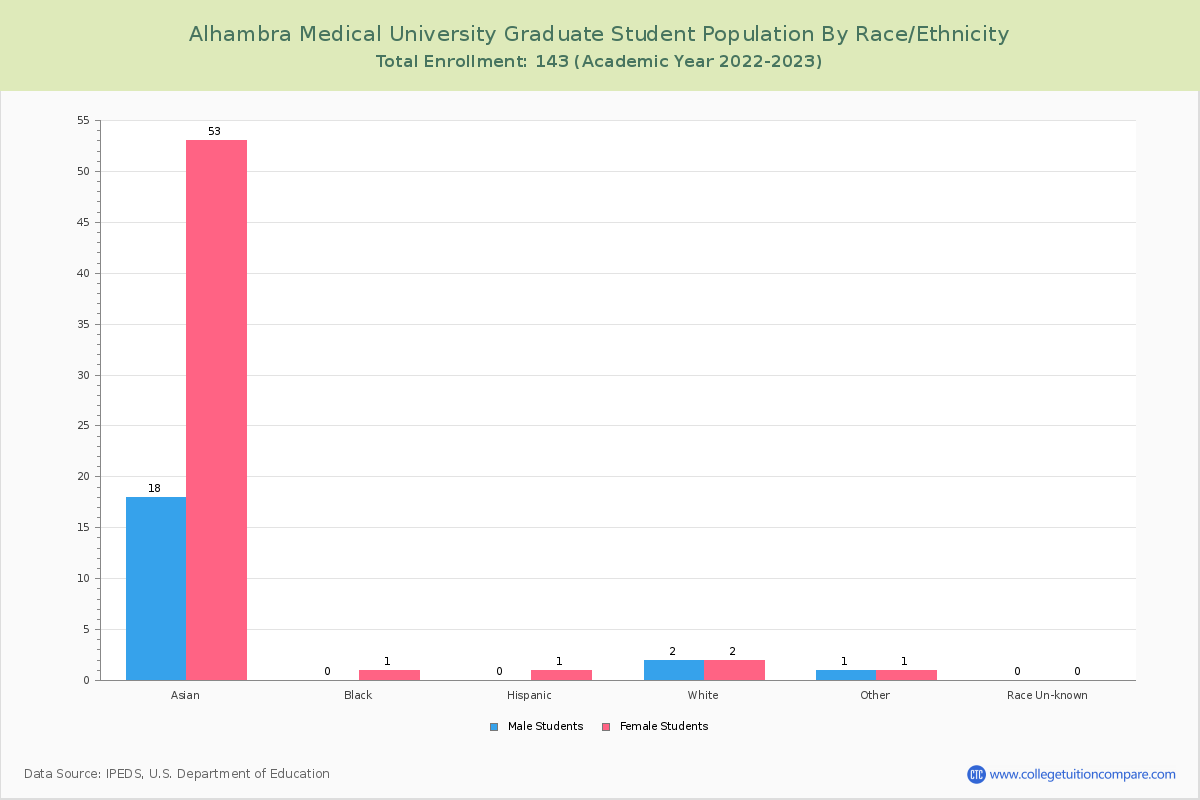
Student Distribution by Race/Ethnicity
By race/ethnicity, 5 White, 1 Black, and 120 Asian students out of a total of 143 are attending at Alhambra Medical University. Comprehensive enrollment statistic data by race/ethnicity is shown in the next chart (Academic year 2022-2023 data).
| Race | Total | Men | Women |
|---|---|---|---|
| American Indian or Native American | 0 | 0 | 0 |
| Asian | 120 | 29 | 91 |
| Black | 1 | 0 | 1 |
| Hispanic | 3 | 1 | 2 |
| Native Hawaiian or Other Pacific Islanders | 0 | 0 | 0 |
| White | 5 | 2 | 3 |
| Two or more races | 0 | 0 | 0 |
| Race Unknown | 0 | 0 | 0 |
| Race | Total | Men | Women |
|---|---|---|---|
| American Indian or Native American | 0 | 0 | 0 |
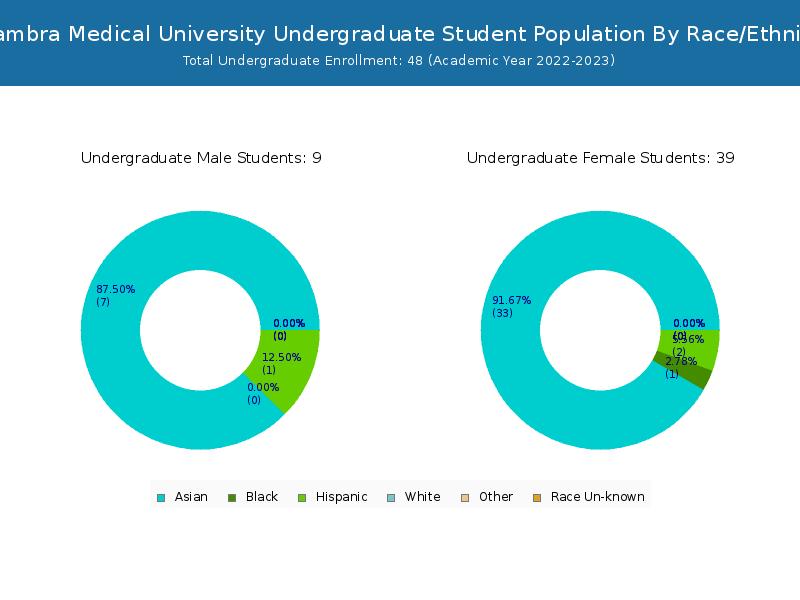
| Asian | 44 | 12 | 32 |
| Black | 0 | 0 | 0 |
| Hispanic | 0 | 0 | 0 |
| Native Hawaiian or Other Pacific Islanders | 0 | 0 | 0 |
| White | 1 | 0 | 1 |
| Two or more races | 0 | 0 | 0 |
| Race Unknown | 0 | 0 | 0 |
| Race | Total | Men | Women |
|---|---|---|---|
| American Indian or Native American | 0 | 0 | 0 |
| Asian | 8 | 4 | 4 |
| Black | 0 | 0 | 0 |
| Hispanic | 0 | 0 | 0 |
| Native Hawaiian or Other Pacific Islanders | 0 | 0 | 0 |
| White | 0 | 0 | 0 |
| Two or more races | 0 | 0 | 0 |
| Race Unknown | 0 | 0 | 0 |
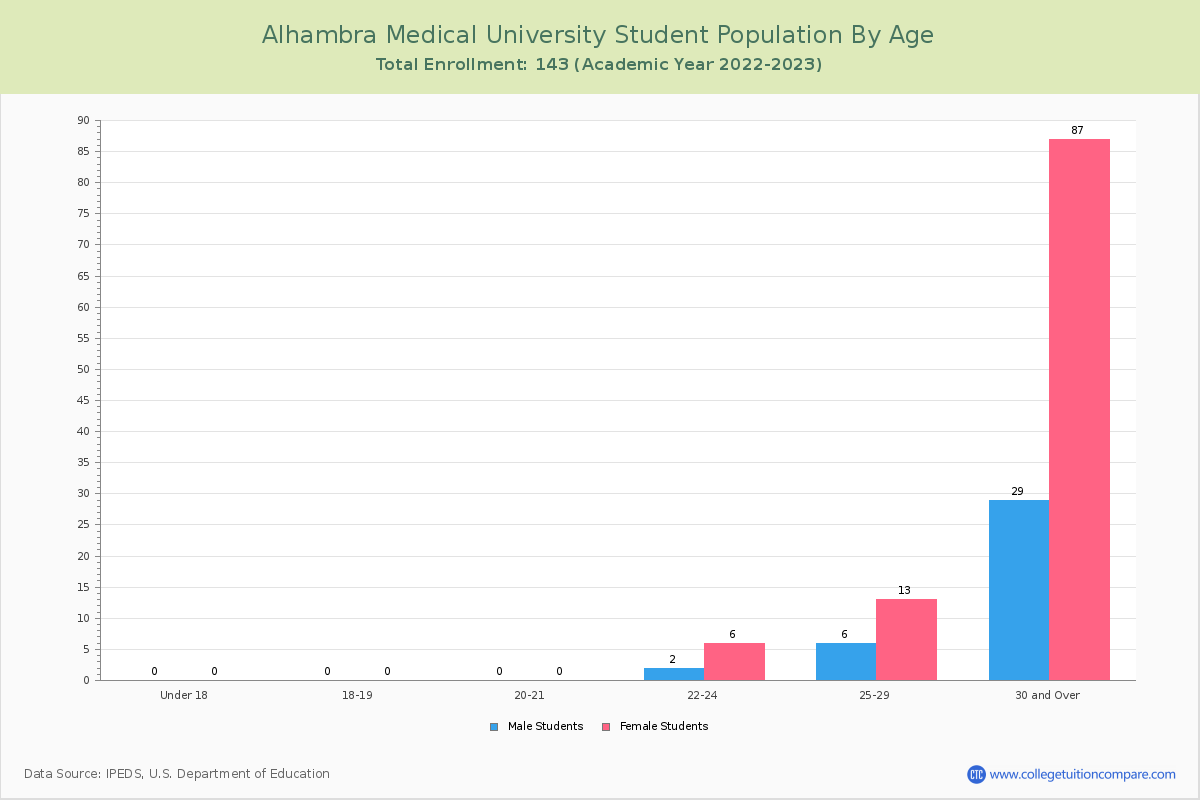
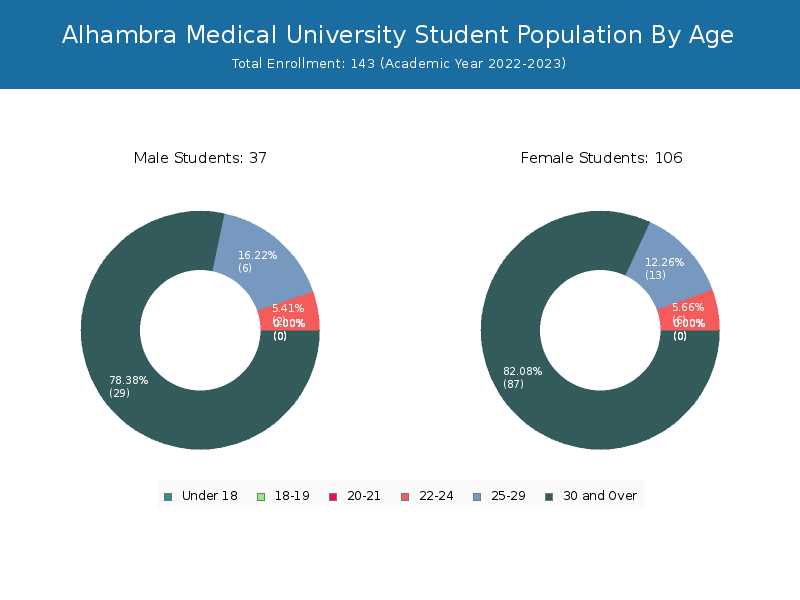
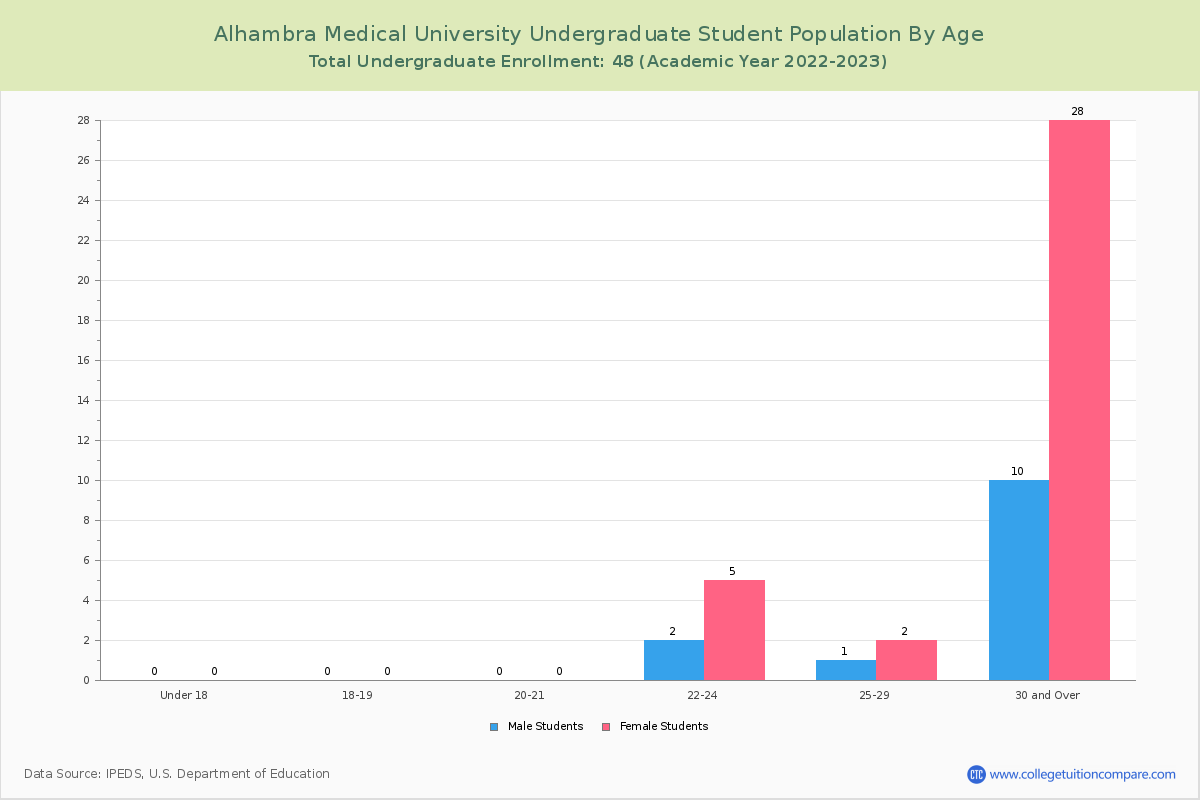
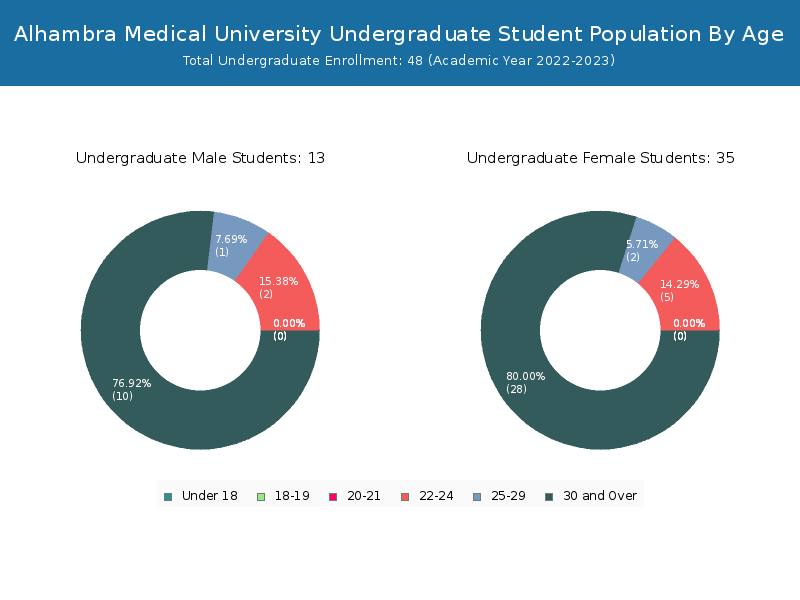
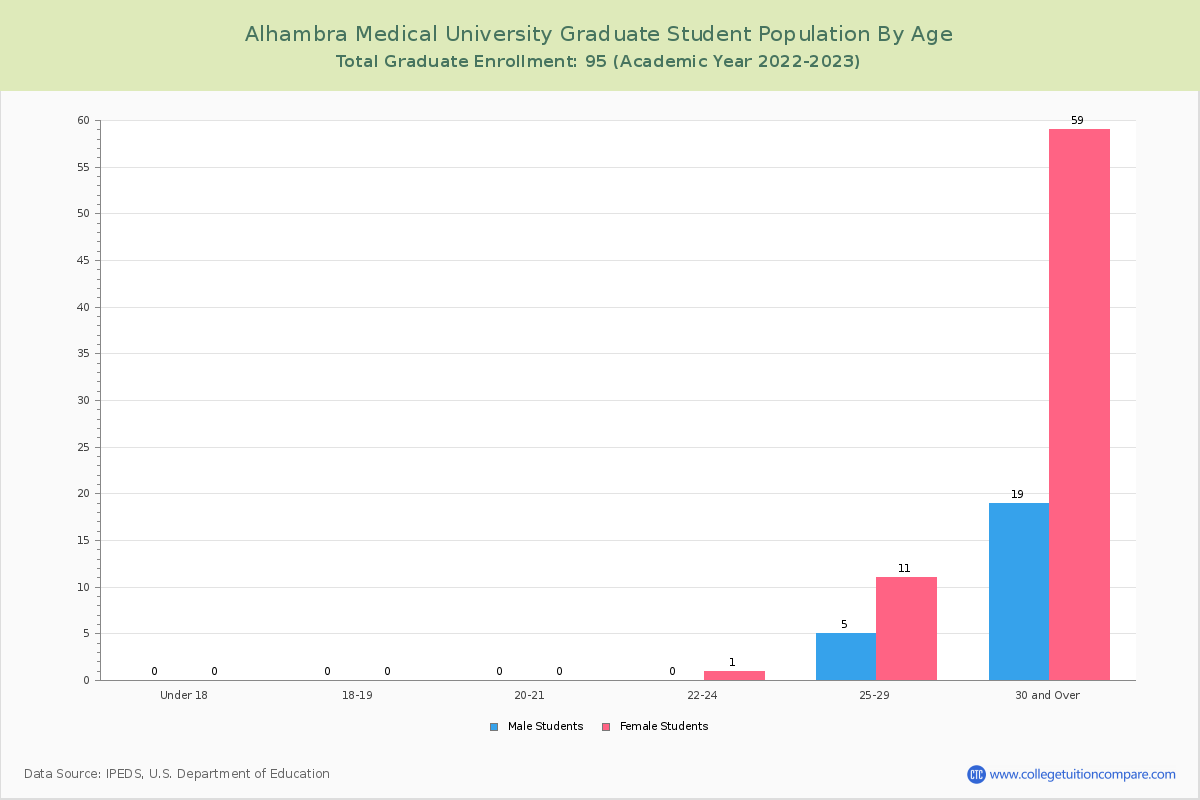
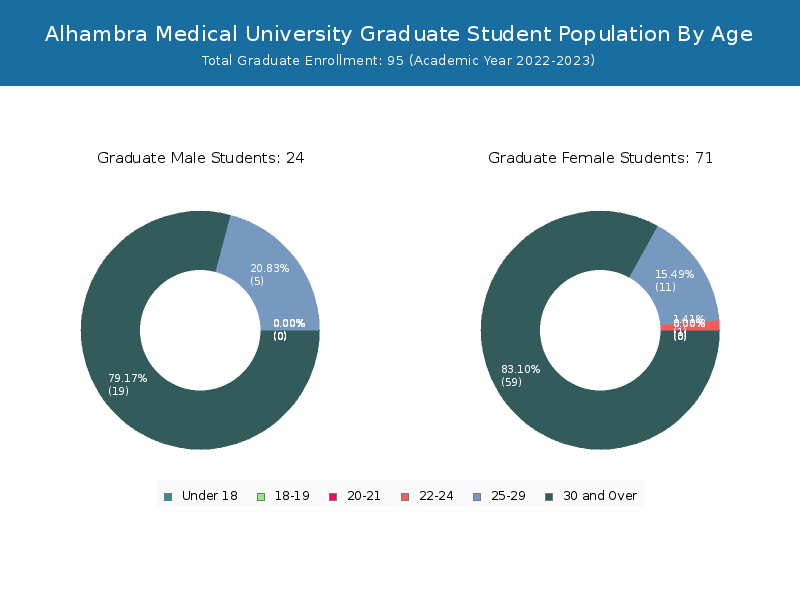
Student Age Distribution
There are 8 students under 25 years old, and 135 students over 25 years old out of 143 total students.
Alhambra Medical has 7 undergraduate students aged under 25 and 41 students aged 25 and over.
It has 1 graduate students aged under 25 and 94 students aged 25 and over.
| Age | Total | Men | Women |
|---|
| Age | Total | Men | Women |
|---|
| Age | Total | Men | Women |
|---|
Transfer-in Students (Undergraduate)
Among 48 enrolled in undergraduate programs, 8 students have transferred-in from other institutions. The percentage of transfer-in students is 16.67%.6 students have transferred in as full-time status and 2 students transferred in as part-time status.
| Number of Students | |
|---|---|
| Regular Full-time | 26 |
| Transfer-in Full-time | 6 |
| Regular Part-time | 14 |
| Transfer-in Part-time | 2 |