Student Population by Gender
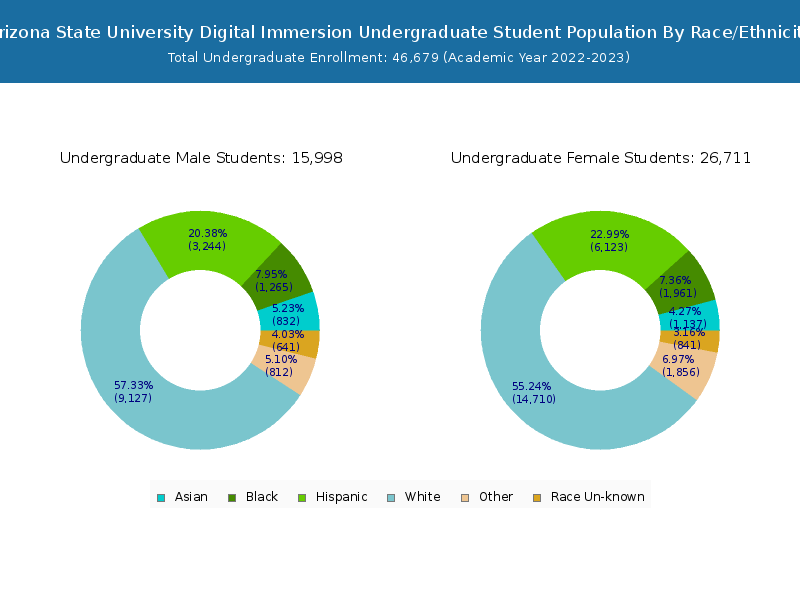
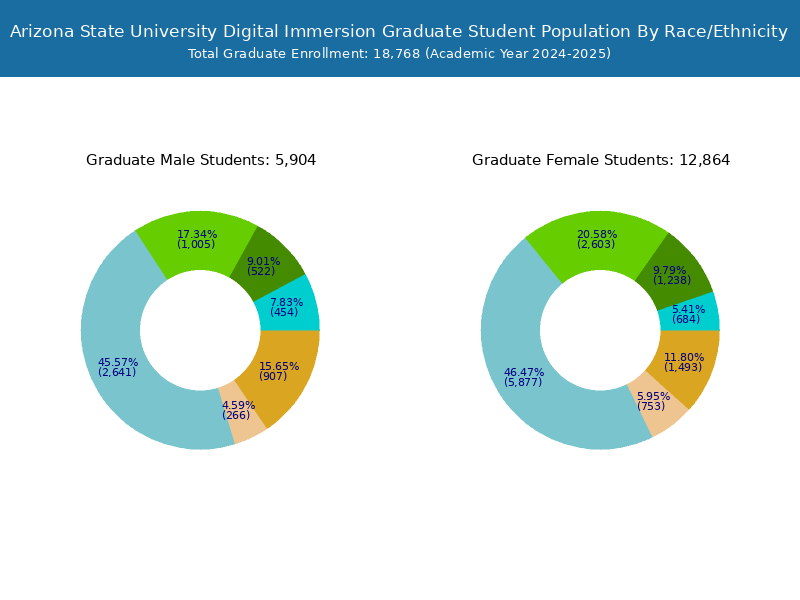
Arizona State University Digital Immersion has a total of 62,551 enrolled students for the academic year 2022-2023. 46,679 students have enrolled in undergraduate programs and 15,872 students joined graduate programs.
By gender, 22,305 male and 40,246 female students (the male-female ratio is 36:64) are attending the school. The gender distribution is based on the 2022-2023 data.
| Total | Undergraduate | Graduate | |
|---|---|---|---|
| Total | 62,551 | 46,679 | 15,872 |
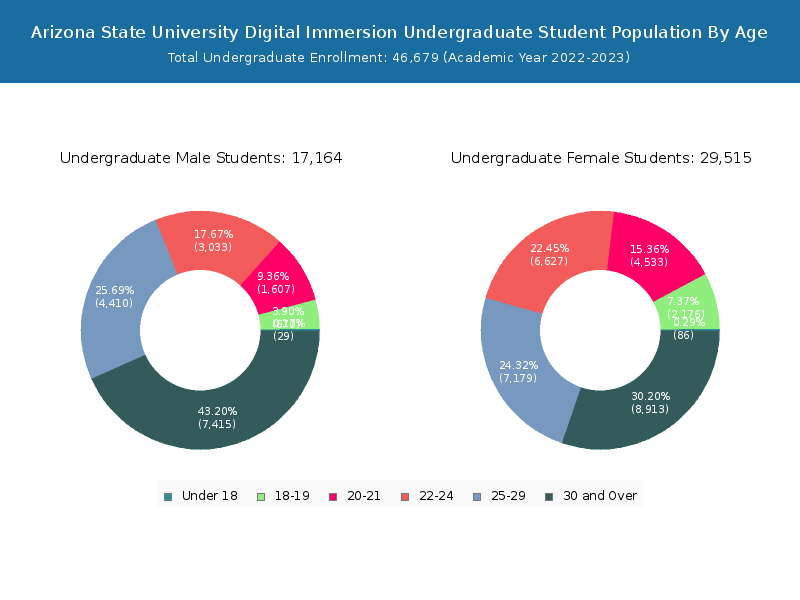
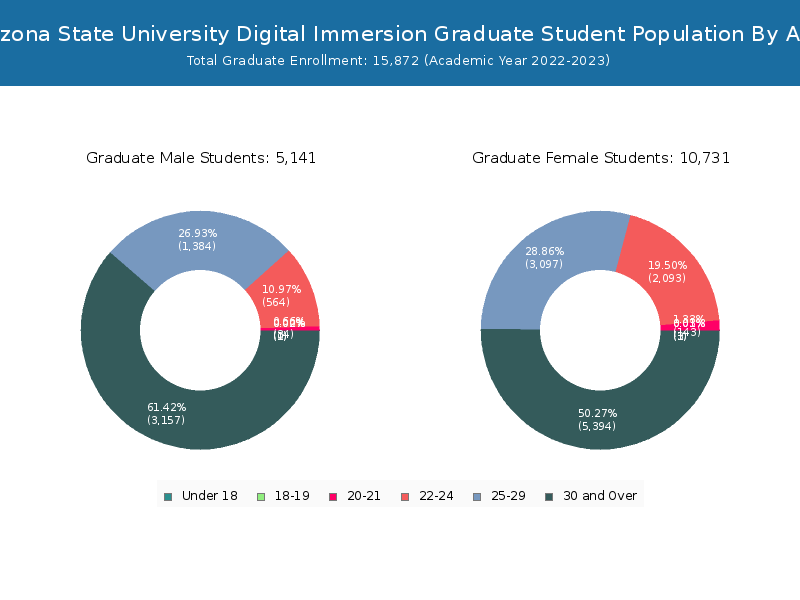
| Men | 22,305 | 17,164 | 5,141 |
| Women | 40,246 | 29,515 | 10,731 |
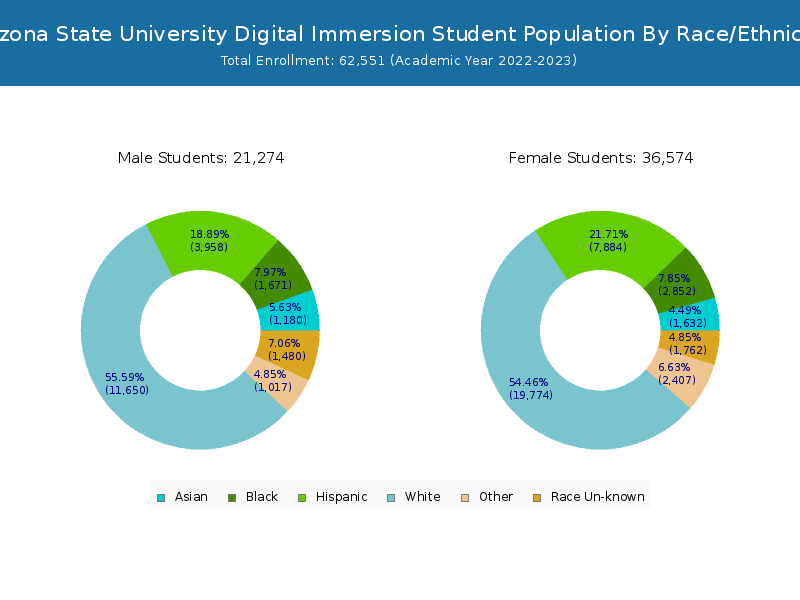
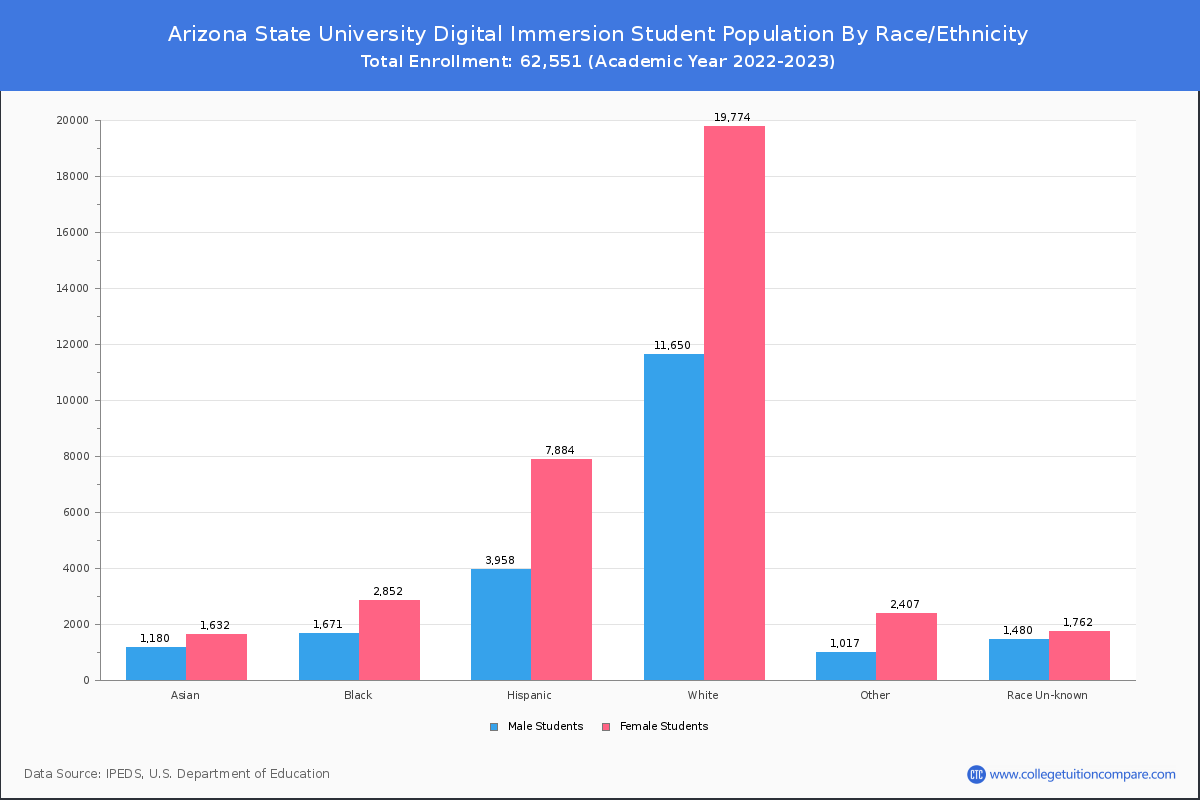
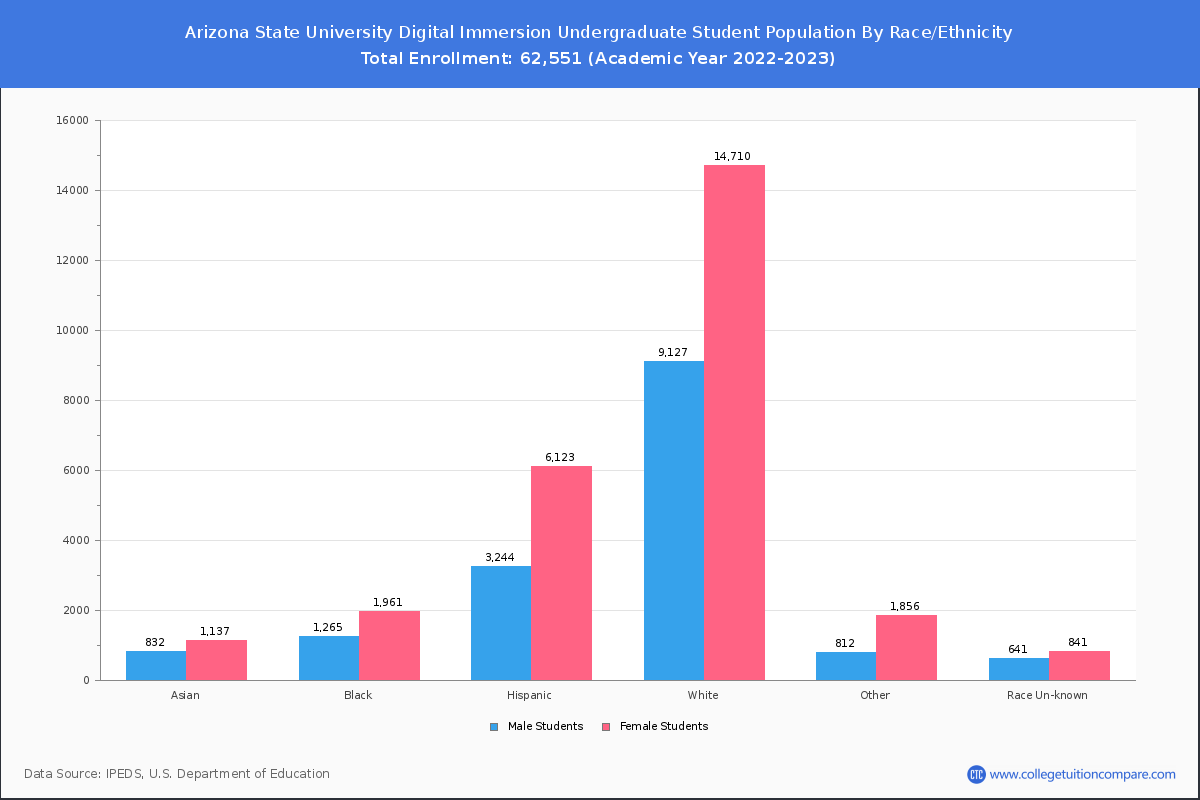
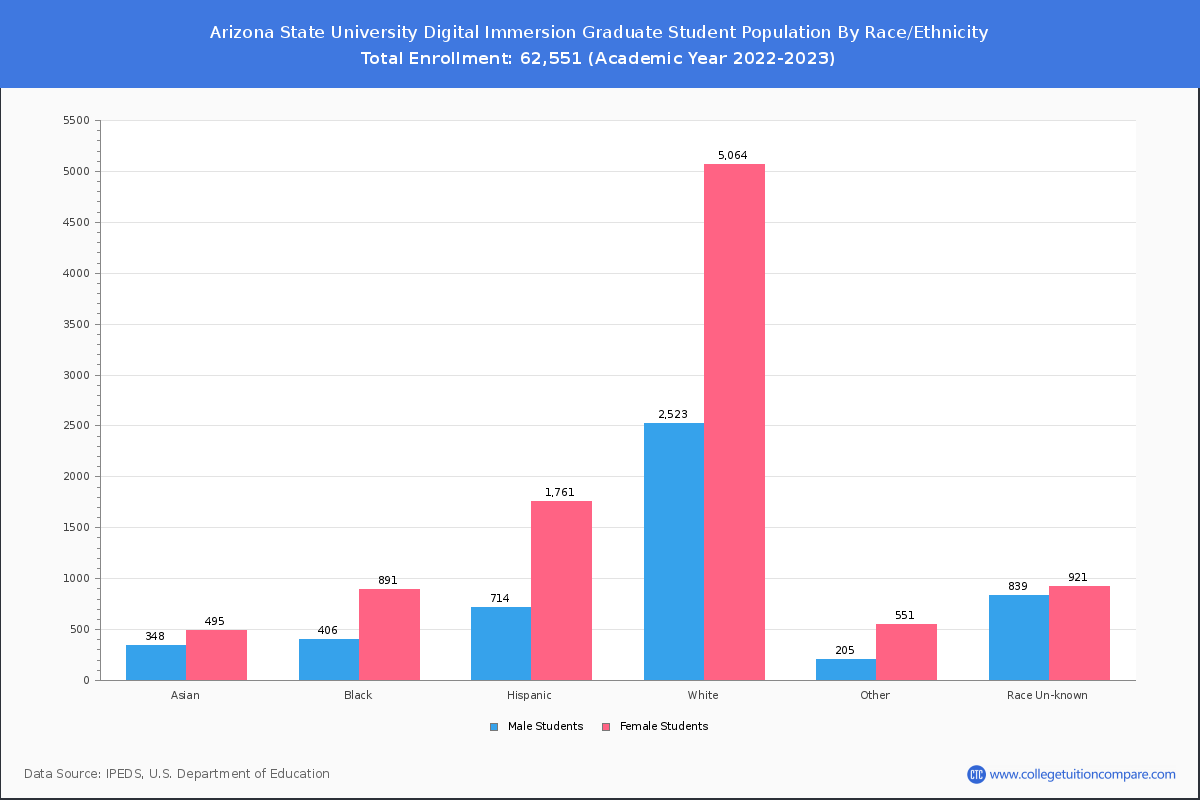
Student Distribution by Race/Ethnicity
By race/ethnicity, 32,582 White, 4,868 Black, and 3,109 Asian students out of a total of 62,551 are attending at Arizona State University Digital Immersion. Comprehensive enrollment statistic data by race/ethnicity is shown in the next chart (Academic year 2022-2023 data).
| Race | Total | Men | Women |
|---|---|---|---|
| American Indian or Native American | 679 | 178 | 501 |
| Asian | 3,109 | 1,283 | 1,826 |
| Black | 4,868 | 1,743 | 3,125 |
| Hispanic | 13,544 | 4,435 | 9,109 |
| Native Hawaiian or Other Pacific Islanders | 225 | 67 | 158 |
| White | 32,582 | 11,578 | 21,004 |
| Two or more races | 2,784 | 806 | 1,978 |
| Race Unknown | 4,302 | 1,995 | 2,307 |
| Race | Total | Men | Women |
|---|---|---|---|
| American Indian or Native American | 473 | 116 | 357 |
| Asian | 2,198 | 905 | 1,293 |
| Black | 3,534 | 1,359 | 2,175 |
| Hispanic | 10,846 | 3,659 | 7,187 |
| Native Hawaiian or Other Pacific Islanders | 157 | 49 | 108 |
| White | 24,981 | 9,250 | 15,731 |
| Two or more races | 2,239 | 672 | 1,567 |
| Race Unknown | 2,183 | 1,119 | 1,064 |
| Race | Total | Men | Women |
|---|---|---|---|
| American Indian or Native American | 130 | 33 | 97 |
| Asian | 587 | 241 | 346 |
| Black | 935 | 374 | 561 |
| Hispanic | 2,878 | 944 | 1,934 |
| Native Hawaiian or Other Pacific Islanders | 33 | 9 | 24 |
| White | 5,711 | 2,098 | 3,613 |
| Two or more races | 556 | 163 | 393 |
| Race Unknown | 758 | 439 | 319 |
Student Age Distribution
By age, ASU Skysong has 116 students under 18 years old and 193 students over 65 years old. There are 21,600 students under 25 years old, and 40,949 students over 25 years old out of 62,551 total students.
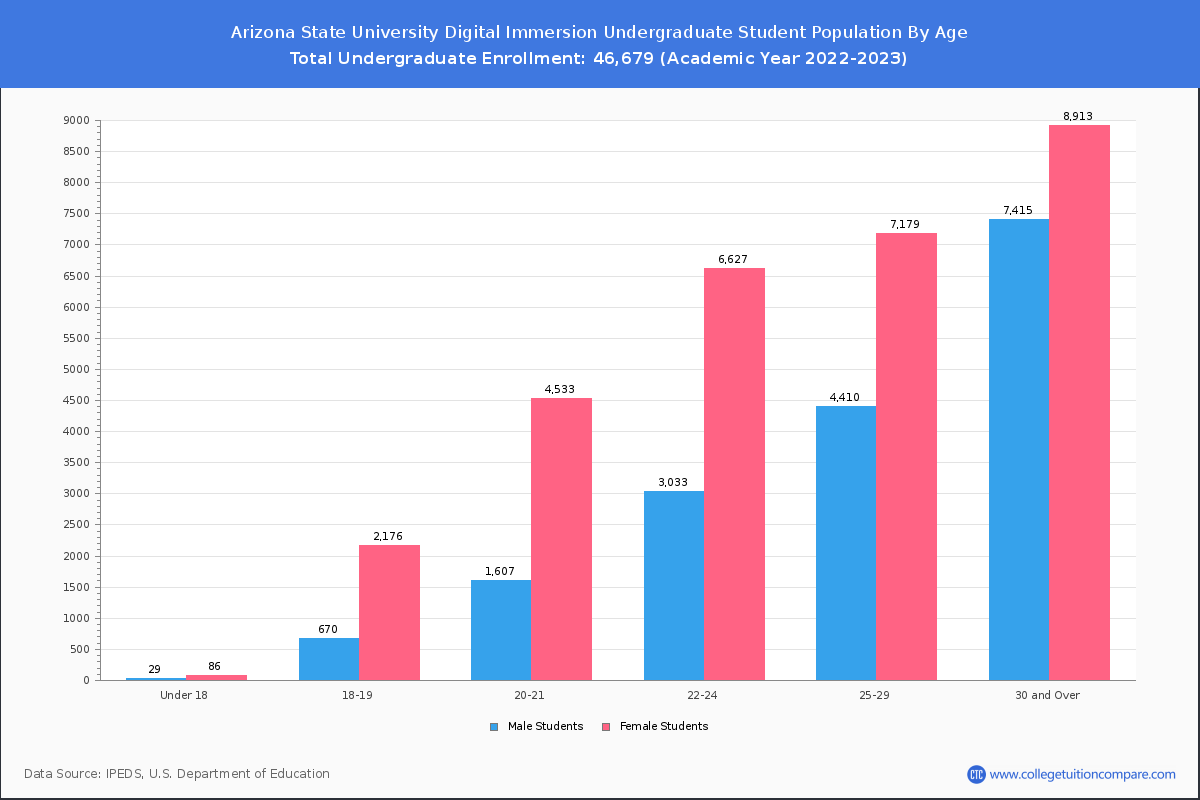
In undergraduate programs, 115 students are younger than 18 and 94 students are older than 65. ASU Skysong has 18,761 undergraduate students aged under 25 and 27,917 students aged 25 and over.
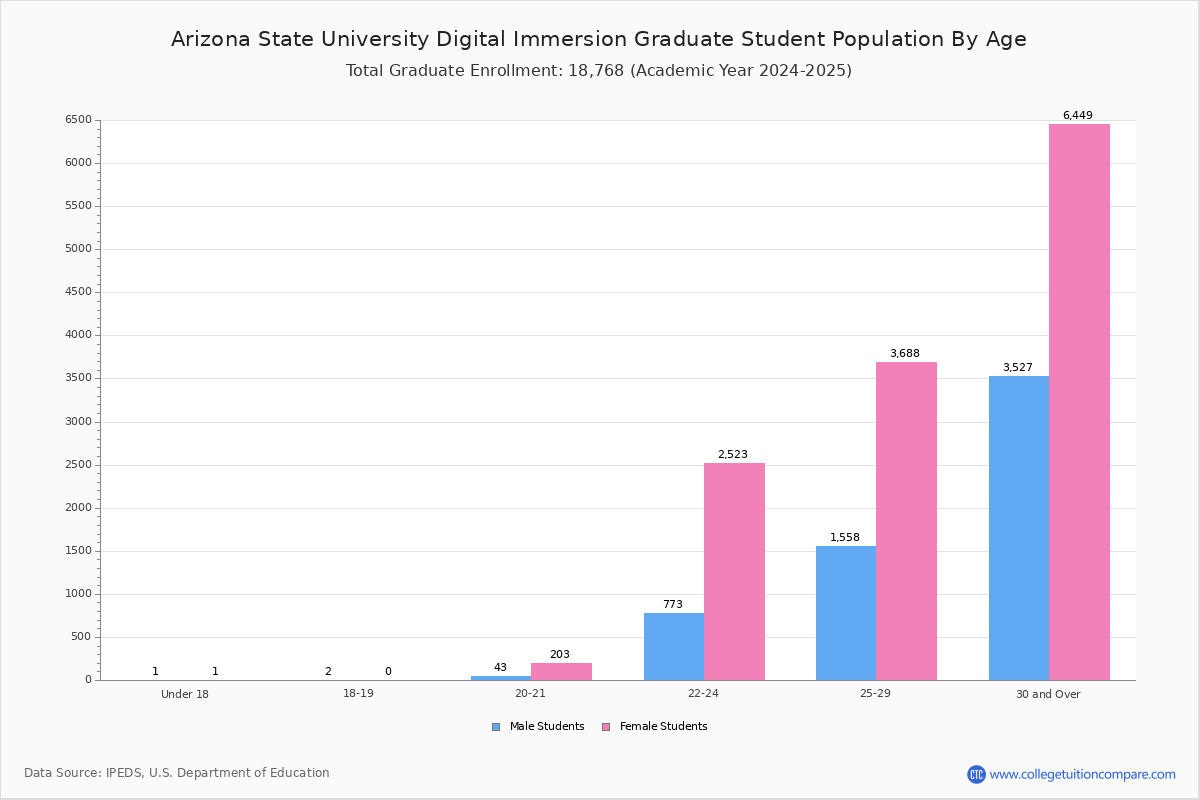
In graduate schools at ASU Skysong, 1 students are younger than 18 and 99 students are older than 65. It has 2,839 graduate students aged under 25 and 13,032 students aged 25 and over.
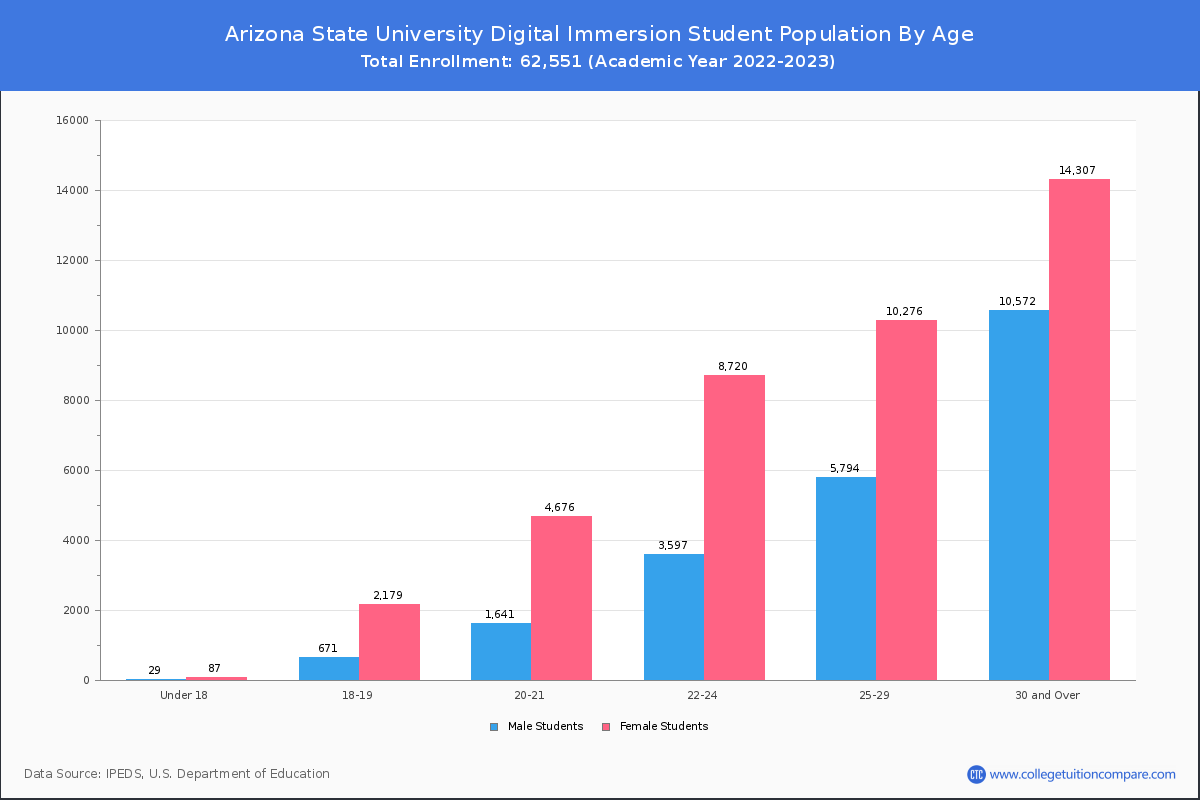
| Age | Total | Men | Women |
|---|---|---|---|
| Under 18 | 116 | 87 | 29 |
| 18-19 | 2,850 | 2,179 | 671 |
| 20-21 | 6,317 | 4,676 | 1,641 |
| 22-24 | 12,317 | 8,720 | 3,597 |
| 25-29 | 16,070 | 10,276 | 5,794 |
| 30-34 | 9,933 | 5,705 | 4,228 |
| 35-39 | 6,126 | 3,416 | 2,710 |
| 40-49 | 6,368 | 3,749 | 2,619 |
| 50-64 | 2,259 | 1,355 | 904 |
| Over 65 | 193 | 82 | 111 |
| Age | Total | Men | Women |
|---|---|---|---|
| Under 18 | 115 | 86 | 29 |
| 18-19 | 2,846 | 2,176 | 670 |
| 20-21 | 6,140 | 4,533 | 1,607 |
| 22-24 | 9,660 | 6,627 | 3,033 |
| 25-29 | 11,589 | 7,179 | 4,410 |
| 30-34 | 7,053 | 3,869 | 3,184 |
| 35-39 | 4,064 | 2,127 | 1,937 |
| 40-49 | 3,874 | 2,141 | 1,733 |
| 50-64 | 1,243 | 734 | 509 |
| Over 65 | 94 | 42 | 52 |
| Age | Total | Men | Women |
|---|---|---|---|
| Under 18 | 1 | 1 | 0 |
| 18-19 | 4 | 3 | 1 |
| 20-21 | 177 | 143 | 34 |
| 22-24 | 2,657 | 2,093 | 564 |
| 25-29 | 4,481 | 3,097 | 1,384 |
| 30-34 | 2,880 | 1,836 | 1,044 |
| 35-39 | 2,062 | 1,289 | 773 |
| 40-49 | 2,494 | 1,608 | 886 |
| 50-64 | 1,016 | 621 | 395 |
| Over 65 | 99 | 40 | 59 |
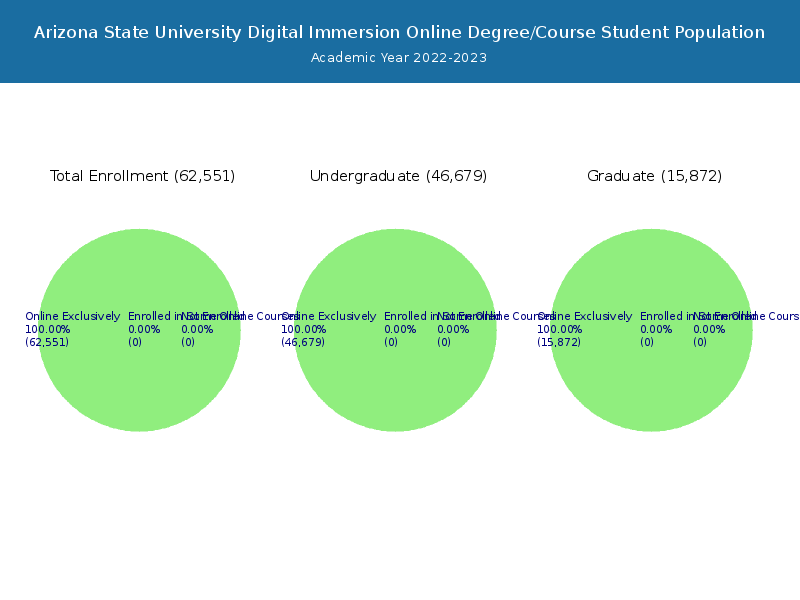
Online Student Enrollment
Distance learning, also called online education, is very attractive to students, especially who want to continue education and work in field. At Arizona State University Digital Immersion, 62,551 students are enrolled exclusively in online courses and 0 students are enrolled in some online courses.
13,252 students lived in Arizona or jurisdiction in which the school is located are enrolled exclusively in online courses and 49,299 students live in other State or outside of the United States.
| All Students | Enrolled Exclusively Online Courses | Enrolled in Some Online Courses | |
|---|---|---|---|
| All Students | 62,551 | 62,551 | 0 |
| Undergraduate | 46,679 | 46,679 | 0 |
| Graduate | 15,872 | 15,872 | 0 |
| Arizona Residents | Other States in U.S. | Outside of U.S. | |
|---|---|---|---|
| All Students | 13,252 | 46,922 | 2,377 |
| Undergraduate | 9,521 | 36,585 | 573 |
| Graduate | 3,731 | 10,337 | 1,804 |
Transfer-in Students (Undergraduate)
Among 46,679 enrolled in undergraduate programs, 11,615 students have transferred-in from other institutions. The percentage of transfer-in students is 24.88%.4,544 students have transferred in as full-time status and 7,071 students transferred in as part-time status.
| Number of Students | |
|---|---|
| Regular Full-time | 13,437 |
| Transfer-in Full-time | 4,544 |
| Regular Part-time | 21,627 |
| Transfer-in Part-time | 7,071 |