Graduation Rates in Reasonable Completion Time
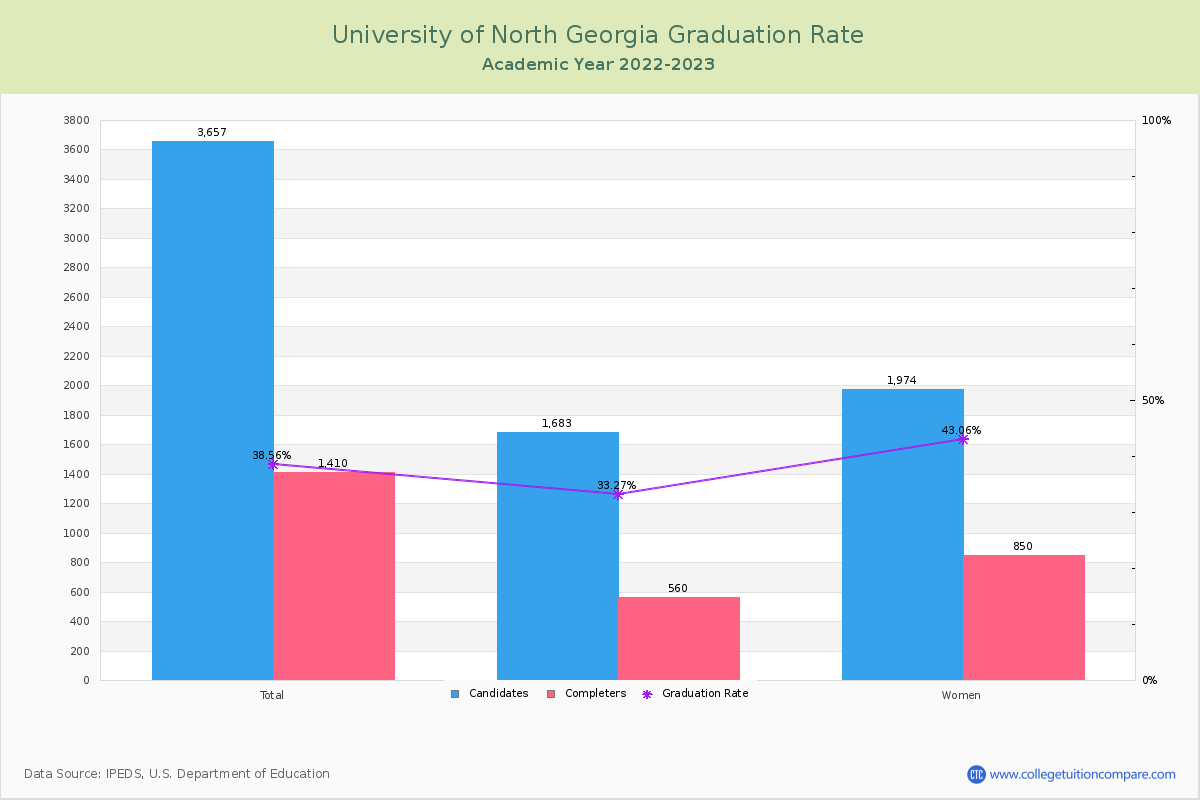
For the academic year 2022-2023, 1,410 students out of 3,657 candidates have completed their courses within 150% normal time (i.e. in 6 years for 4-year BS degree) at University of North Georgia.
By gender, 560 male and 850 female students graduated the school last year completing their jobs in the period. Its graduation rate is relatively lower than the average rate when comparing similar colleges' rate of 48.89% (public Master's College and University with larger programs).
| Candidates | Completers | Graduation Rates | |
|---|---|---|---|
| Total | 3,657 | 1,410 | 38.56% |
| Men | 1,683 | 560 | 33.27% |
| Women | 1,974 | 850 | 43.06% |
Graduation Rate By Race/Ethnicity
| Total | Male | Female | |
|---|---|---|---|
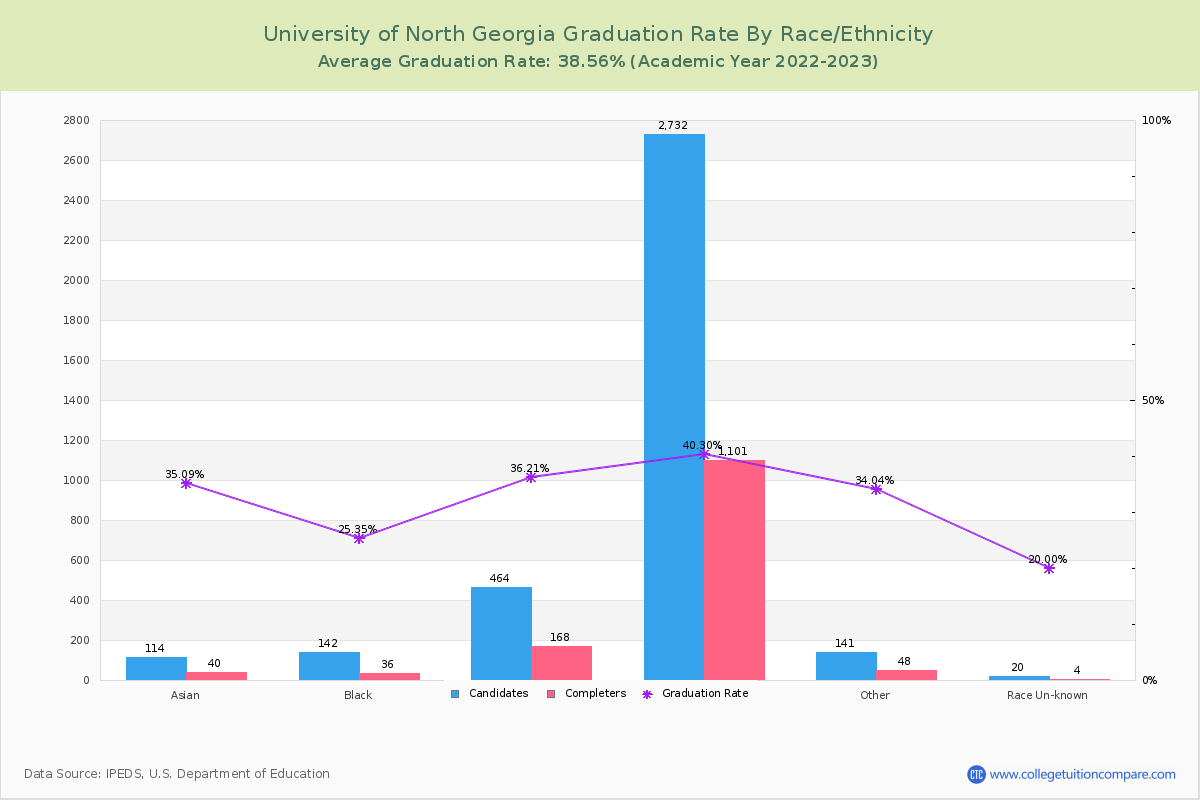
| American Indian or Alaska Native | 28.57%(2/7) | 50.00%(2/4) | - |
| Asian | 35.09%(40/114) | 27.42%(17/62) | 44.23%(23/52) |
| Black (Non-Hispanic) | 25.35%(36/142) | 14.29%(8/56) | 32.56%(28/86) |
| Hispanic | 36.21%(168/464) | 30.33%(64/211) | 41.11%(104/253) |
| White | 40.30%(1,101/2,732) | 35.01%(439/1,254) | 44.79%(662/1,478) |
| Native Hawaiian or Other Pacific Islander | 16.67%(1/6) | 25.00%(1/4) | - |
| Two or More Race | 35.16%(45/128) | 34.48%(20/58) | 35.71%(25/70) |
| Unknown | 20.00%(4/20) | 25.00%(3/12) | 12.50%(1/8) |
Transfer-out and Retention Rates
At UNG, the transfer-out rate is 30.63%. Its transfer-out rate is higher than the average rate when comparing similar colleges' rate of 22.68%.
UNG's retention rate is 72% for full-time students and 51 % for part-time students last year. Its retention rate is around the average rate when comparing similar colleges' rate of 71.18%.
Non-Resident Alien Graduation Rate
A non-resident alien student is not a US citizen/green card holder and studies with a student visa, such as an F visa, in the United States. At University of North Georgia, 13 of 44 non-resident alien students completed their studies and the graduation rate was 29.55%.

