Graduation Rates in Reasonable Completion Time
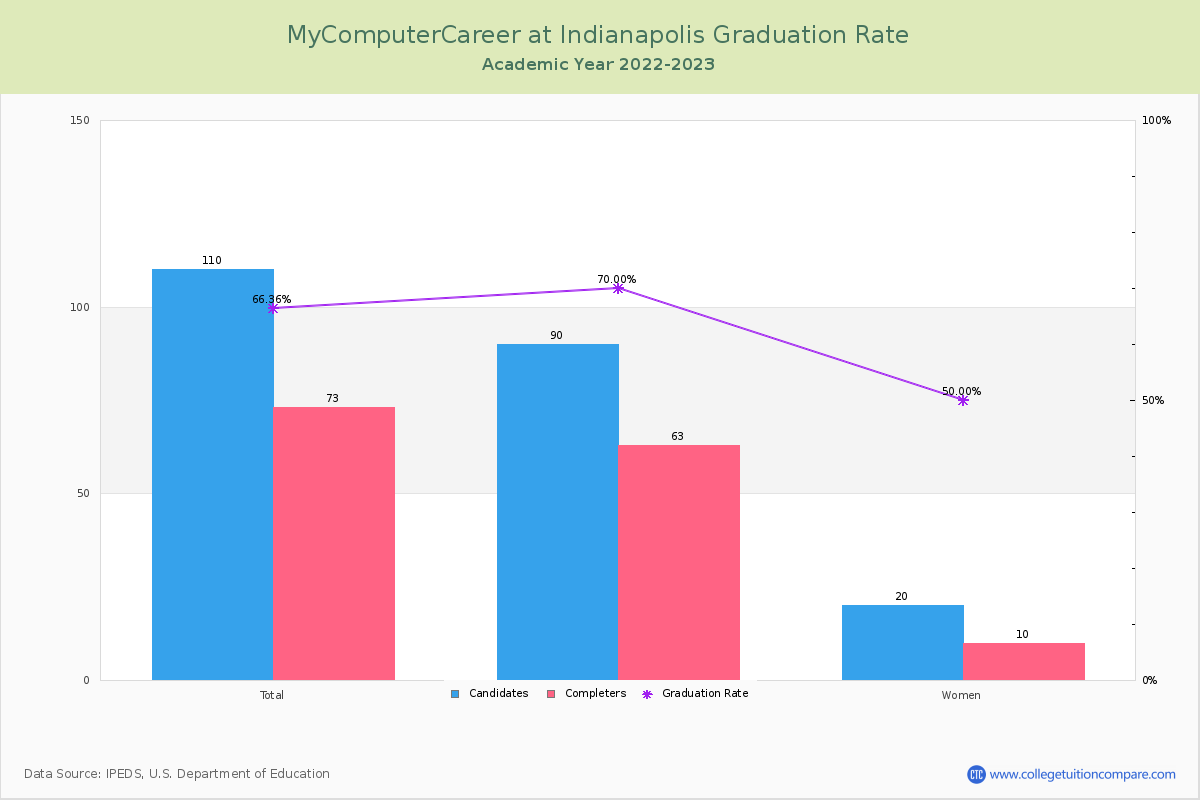
For the academic year 2022-2023, 73 students out of 110 candidates have completed their courses within 150% normal time (i.e. in 3 years for 2-year Associate degree) at MyComputerCareer at Indianapolis.
By gender, 63 male and 10 female students graduated the school last year completing their jobs in the period. Its graduation rate is around the average rate when comparing similar colleges' rate of 64.87% (private (for-profit) ).
| Candidates | Completers | Graduation Rates | |
|---|---|---|---|
| Total | 110 | 73 | 66.36% |
| Men | 90 | 63 | 70.00% |
| Women | 20 | 10 | 50.00% |
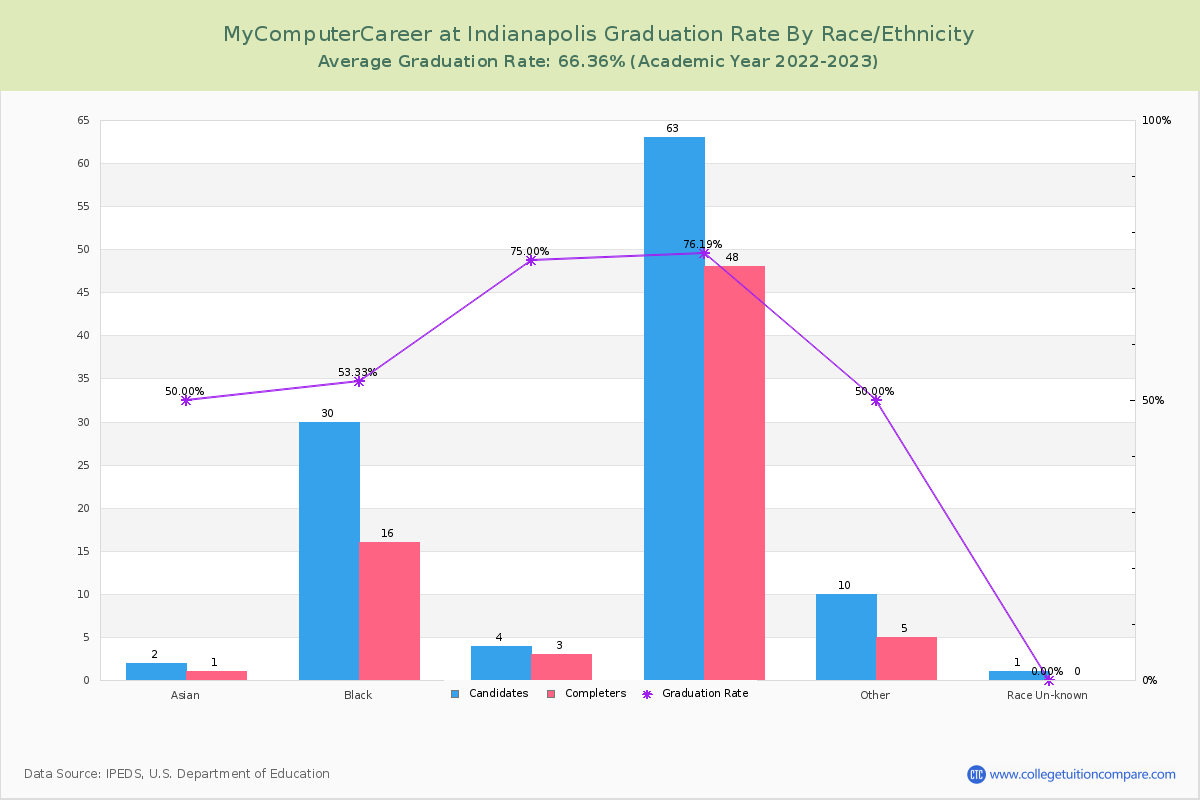
Graduation Rate By Race/Ethnicity
The following table shows graduation rate by race and at MyComputerCareer at Indianapolis.
- American Indian or Alaska Native: 100.00%
- Asian: 50.00%
- Black (Non-Hispanic): 53.33%
- Hispanic: 75.00%
- White: 76.19%
- Native Hawaiian or Other Pacific Islander: 100.00%
- Two or More Race: 37.50%
- Unknown: 0.00%
| Total | Male | Female | |
|---|---|---|---|
| American Indian or Alaska Native | 100.00%(1/1) | 100.00%(1/1) | - |
| Asian | 50.00%(1/2) | 100.00%(1/1) | - |
| Black (Non-Hispanic) | 53.33%(16/30) | 60.87%(14/23) | 28.57%(2/7) |
| Hispanic | 75.00%(3/4) | 75.00%(3/4) | - |
| White | 76.19%(48/63) | 76.92%(40/52) | 72.73%(8/11) |
| Native Hawaiian or Other Pacific Islander | 100.00%(1/1) | 100.00%(1/1) | - |
| Two or More Race | 37.50%(3/8) | 42.86%(3/7) | - |
| Unknown | 0.00%(-/1) | - | - |
Transfer-out and Retention Rates
At MyComputerCareer at Indianapolis, the transfer-out rate is 5.45%. Its transfer-out rate is lower than the average rate when comparing similar colleges' rate of 7.08%.
MyComputerCareer at Indianapolis's retention rate is 62% last year. Its retention rate is relatively lower than the average rate when comparing similar colleges' rate of 76.45%.