Student Population by Gender
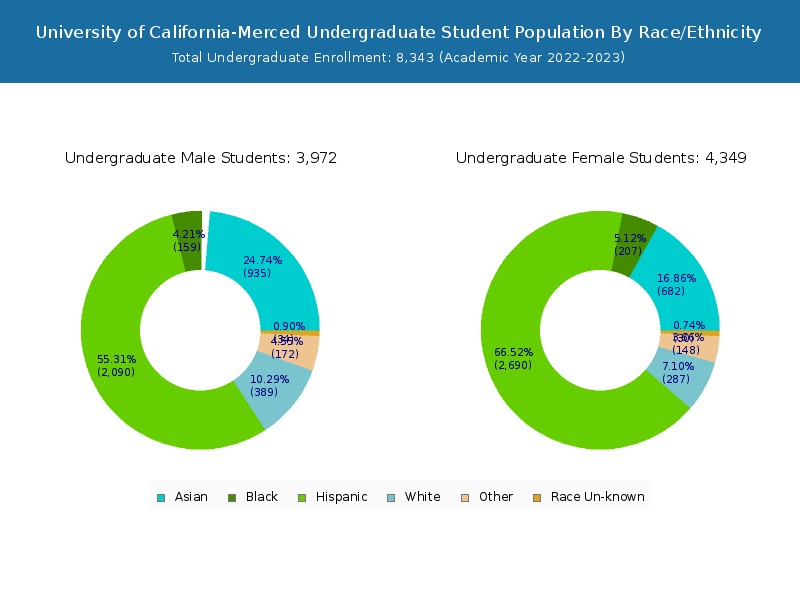
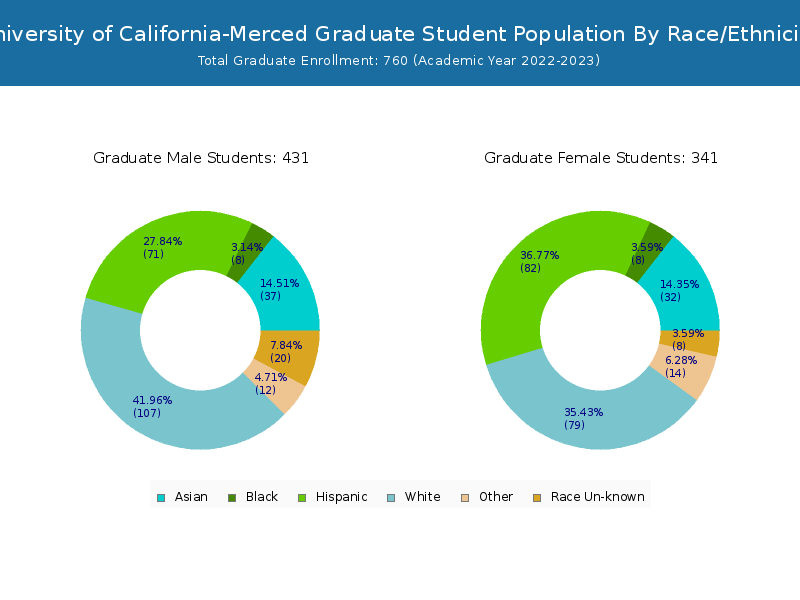
University of California-Merced has a total of 9,103 enrolled students for the academic year 2022-2023. 8,343 students have enrolled in undergraduate programs and 760 students joined graduate programs.
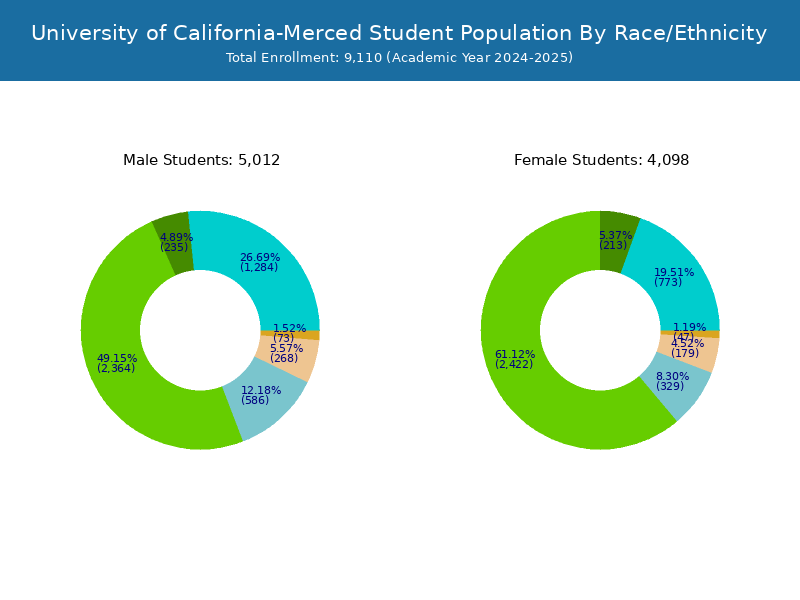
By gender, 4,674 male and 4,429 female students (the male-female ratio is 51:49) are attending the school. The gender distribution is based on the 2022-2023 data.
| Total | Undergraduate | Graduate | |
|---|---|---|---|
| Total | 9,103 | 8,343 | 760 |
| Men | 4,674 | 4,251 | 423 |
| Women | 4,429 | 4,092 | 337 |
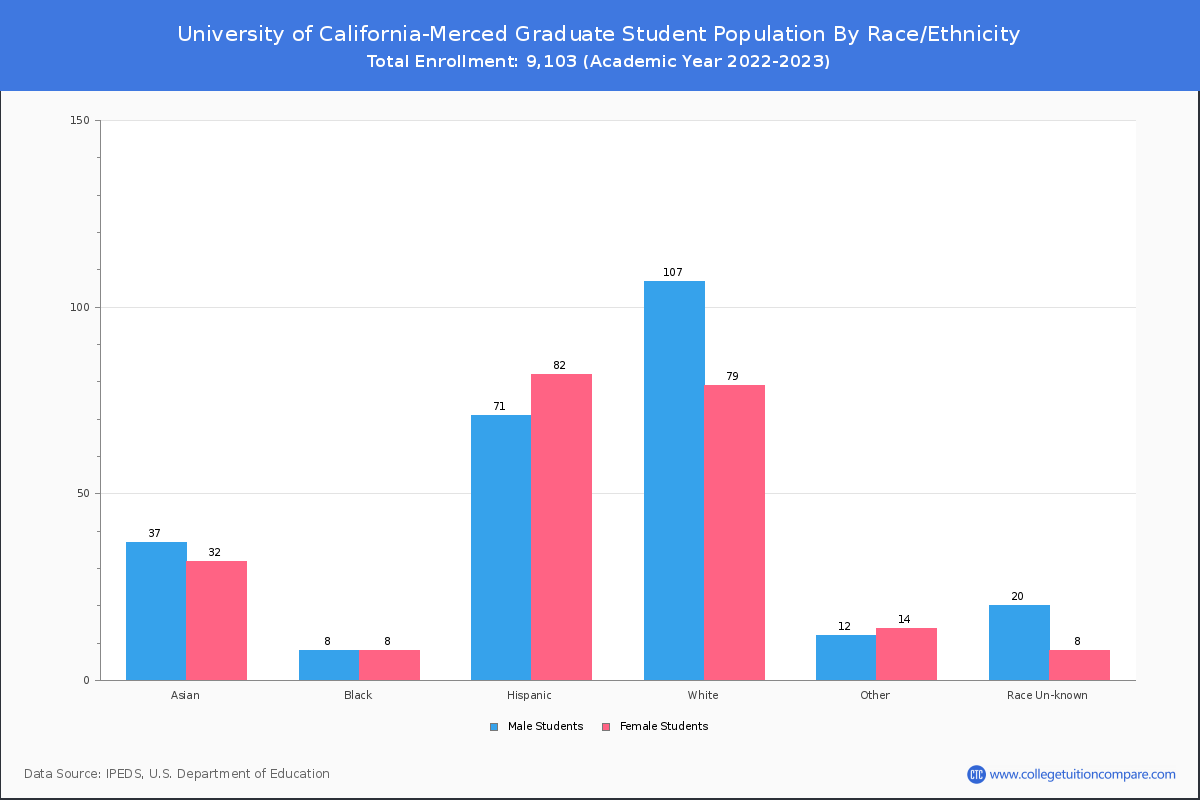
Student Distribution by Race/Ethnicity
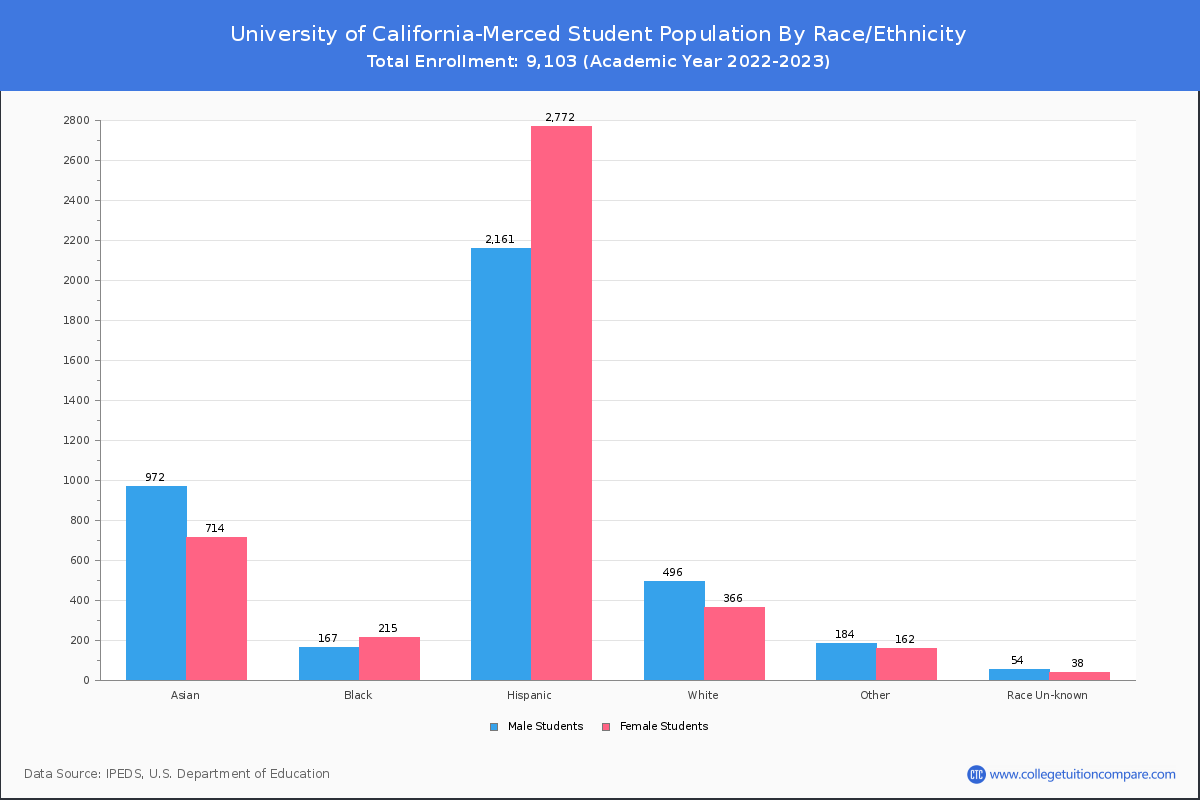
By race/ethnicity, 887 White, 403 Black, and 1,855 Asian students out of a total of 9,103 are attending at University of California-Merced. Comprehensive enrollment statistic data by race/ethnicity is shown in the next chart (Academic year 2022-2023 data).

| Race | Total | Men | Women |
|---|---|---|---|
| American Indian or Native American | 8 | 4 | 4 |
| Asian | 1,855 | 1,144 | 711 |
| Black | 403 | 190 | 213 |
| Hispanic | 4,763 | 2,184 | 2,579 |
| Native Hawaiian or Other Pacific Islanders | 28 | 15 | 13 |
| White | 887 | 544 | 343 |
| Two or more races | 343 | 191 | 152 |
| Race Unknown | 107 | 68 | 39 |
| Race | Total | Men | Women |
|---|---|---|---|
| American Indian or Native American | 8 | 4 | 4 |
| Asian | 1,785 | 1,099 | 686 |
| Black | 387 | 181 | 206 |
| Hispanic | 4,616 | 2,114 | 2,502 |
| Native Hawaiian or Other Pacific Islanders | 27 | 14 | 13 |
| White | 708 | 447 | 261 |
| Two or more races | 318 | 179 | 139 |
| Race Unknown | 83 | 52 | 31 |
| Race | Total | Men | Women |
|---|---|---|---|
| American Indian or Native American | 1 | 0 | 1 |
| Asian | 35 | 25 | 10 |
| Black | 7 | 4 | 3 |
| Hispanic | 102 | 45 | 57 |
| Native Hawaiian or Other Pacific Islanders | 0 | 0 | 0 |
| White | 36 | 24 | 12 |
| Two or more races | 16 | 7 | 9 |
| Race Unknown | 4 | 3 | 1 |
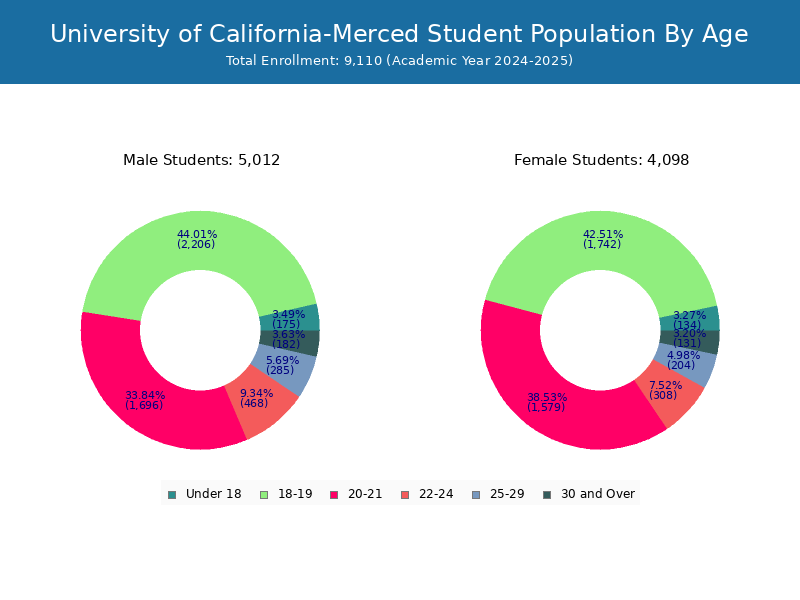
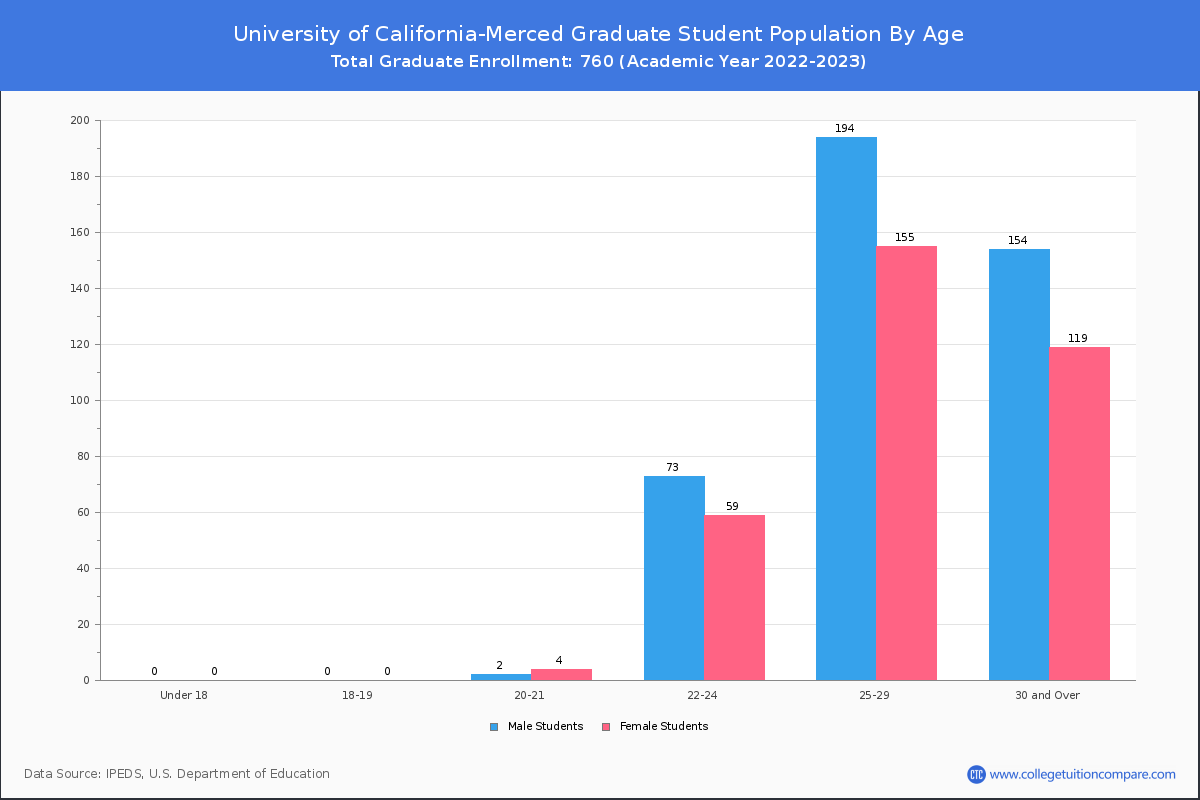
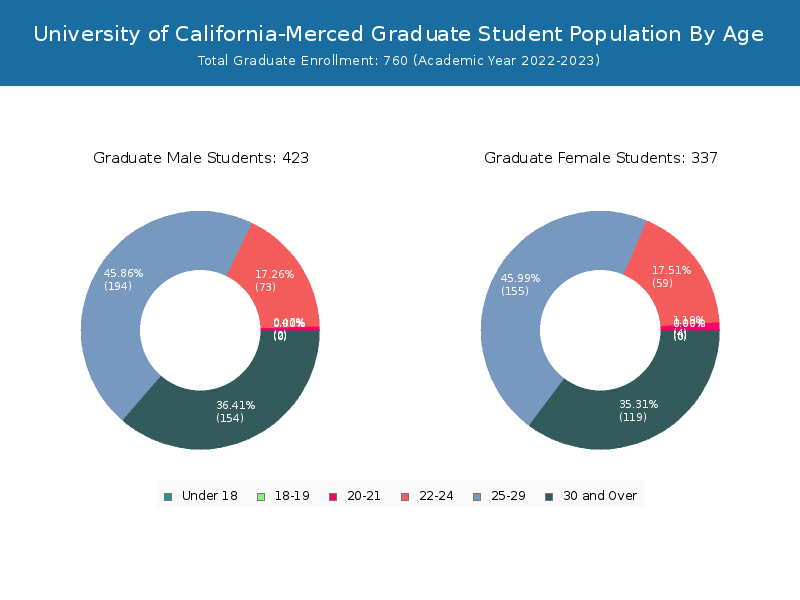
Student Age Distribution
There are 8,259 students under 25 years old, and 844 students over 25 years old out of 9,103 total students.
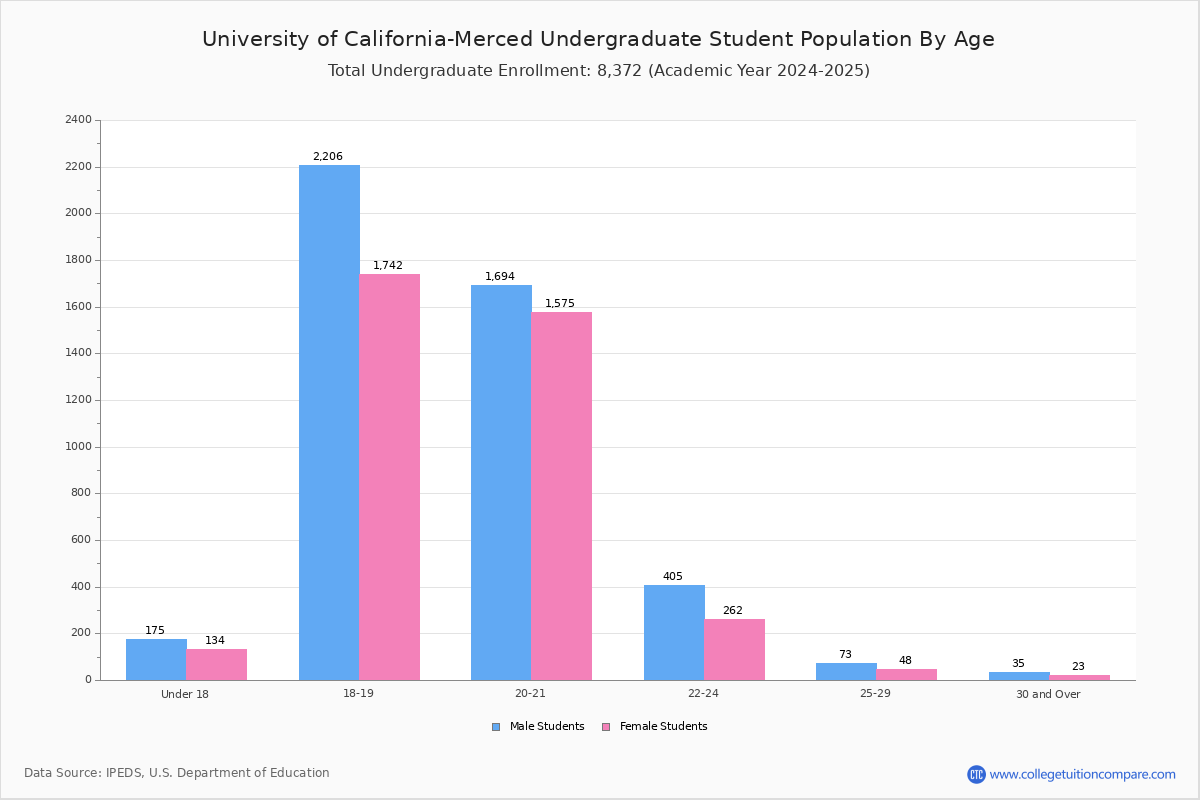
UC Merced has 8,121 undergraduate students aged under 25 and 222 students aged 25 and over.
It has 138 graduate students aged under 25 and 622 students aged 25 and over.
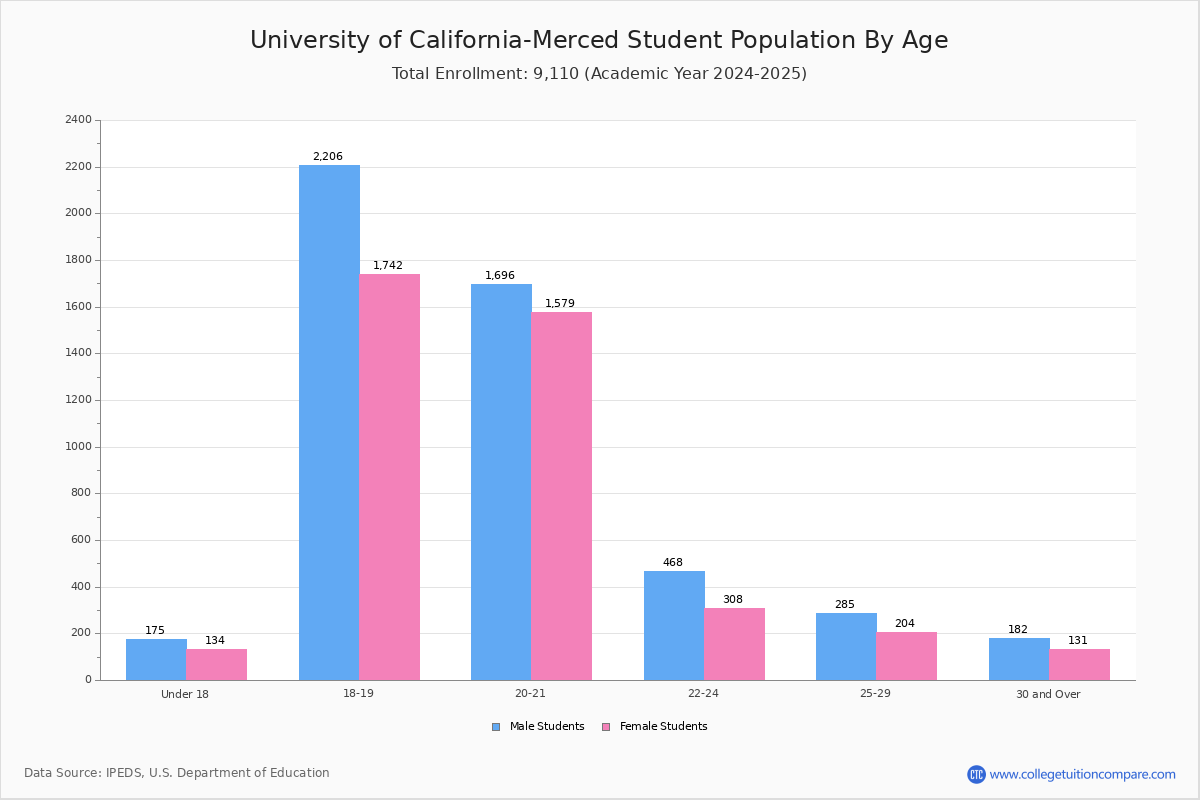
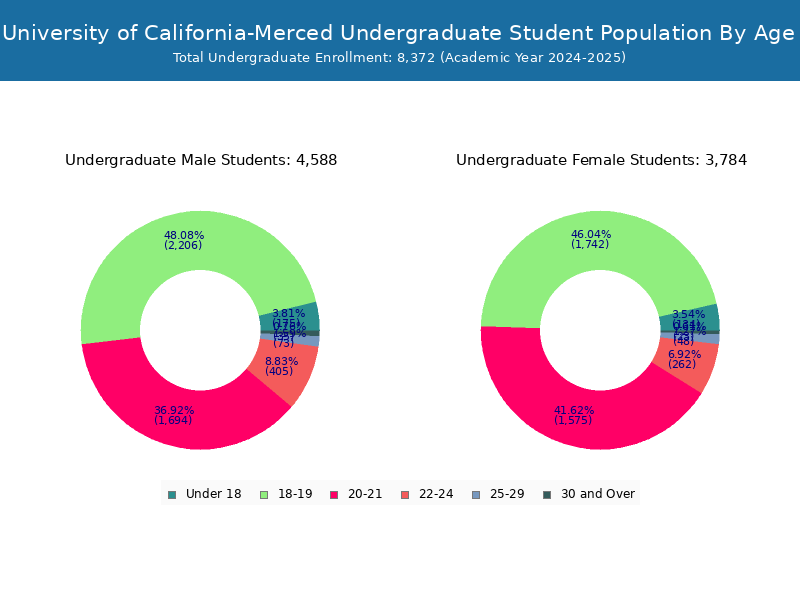
| Age | Total | Men | Women |
|---|---|---|---|
| Under 18 | 391 | 185 | 206 |
| 18-19 | 4,096 | 1,976 | 2,120 |
| 20-21 | 2,835 | 1,528 | 1,307 |
| 22-24 | 937 | 378 | 559 |
| 25-29 | 498 | 207 | 291 |
| 30-34 | 219 | 93 | 126 |
| 35-39 | 66 | 29 | 37 |
| 40-49 | 44 | 26 | 18 |
| 50-64 | 17 | 7 | 10 |
| Age | Total | Men | Women |
|---|---|---|---|
| Under 18 | 391 | 185 | 206 |
| 18-19 | 4,096 | 1,976 | 2,120 |
| 20-21 | 2,829 | 1,524 | 1,305 |
| 22-24 | 805 | 319 | 486 |
| 25-29 | 149 | 52 | 97 |
| 30-34 | 44 | 21 | 23 |
| 35-39 | 14 | 7 | 7 |
| 40-49 | 11 | 6 | 5 |
| 50-64 | 4 | 2 | 2 |
| Age | Total | Men | Women |
|---|
Online Student Enrollment
Distance learning, also called online education, is very attractive to students, especially who want to continue education and work in field. At University of California-Merced, 1,123 students are enrolled in some online courses.
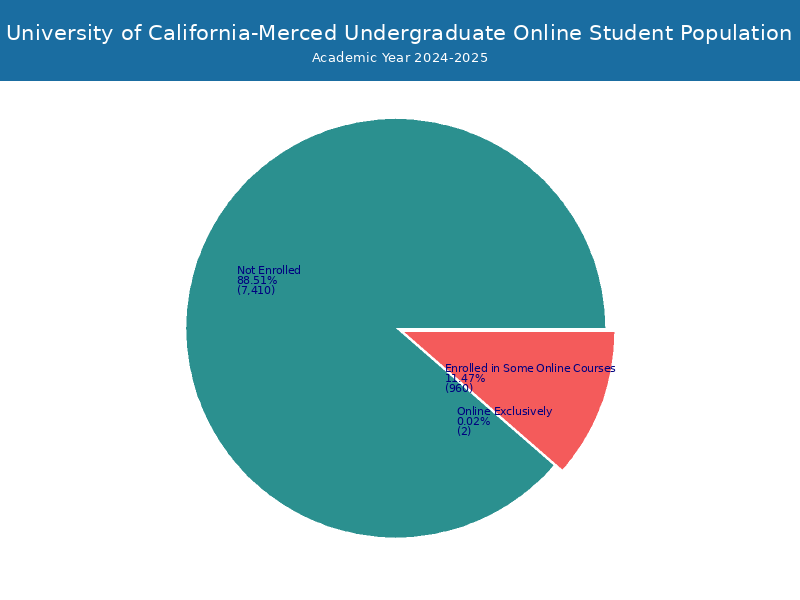
| All Students | Enrolled Exclusively Online Courses | Enrolled in Some Online Courses | |
|---|---|---|---|
| All Students | 9,103 | 0 | 1,123 |
| Undergraduate | 8,343 | 0 | 1,120 |
| Graduate | 760 | 0 | 3 |
| California Residents | Other States in U.S. | Outside of U.S. | |
|---|---|---|---|
| All Students | 0 | - | 0 |
| Undergraduate | 0 | - | 0 |
| Graduate | 0 | - | 0 |
Transfer-in Students (Undergraduate)
Among 8,343 enrolled in undergraduate programs, 213 students have transferred-in from other institutions. The percentage of transfer-in students is 2.55%.207 students have transferred in as full-time status and 6 students transferred in as part-time status.
| Number of Students | |
|---|---|
| Regular Full-time | 7,995 |
| Transfer-in Full-time | 207 |
| Regular Part-time | 135 |
| Transfer-in Part-time | 6 |