Student Population by Gender
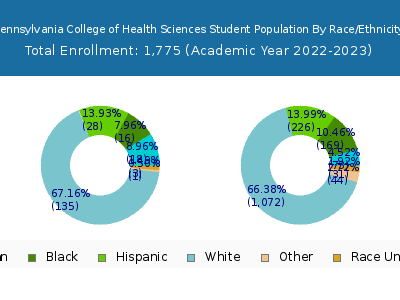
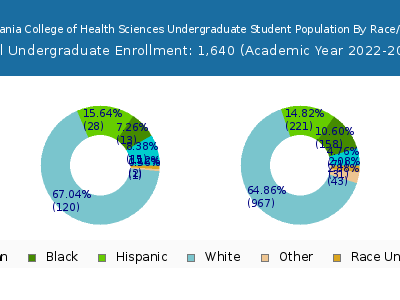
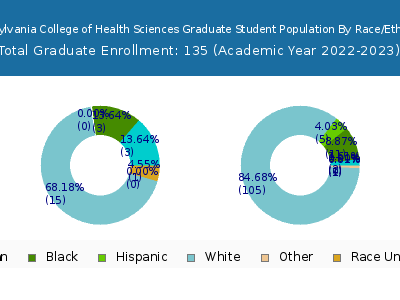
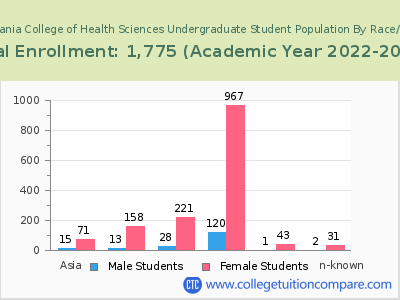
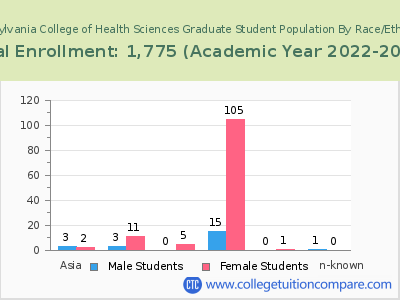
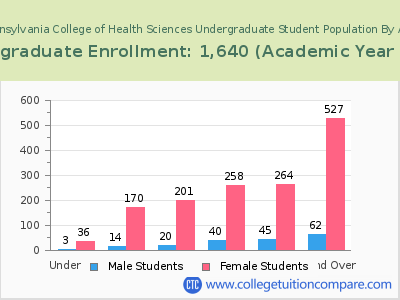
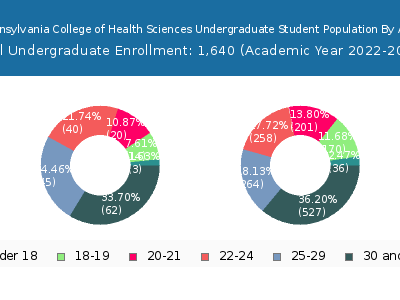
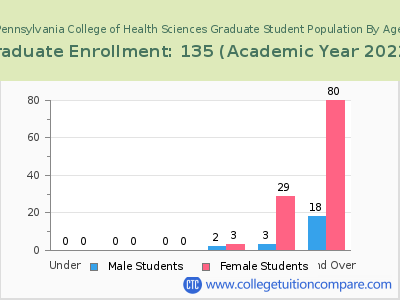
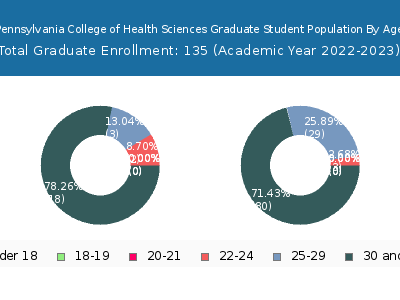
Pennsylvania College of Health Sciences has a total of 1,775 enrolled students for the academic year 2022-2023. 1,640 students have enrolled in undergraduate programs and 135 students joined graduate programs.
By gender, 207 male and 1,568 female students (the male-female ratio is 12:88) are attending the school. The gender distribution is based on the 2022-2023 data.
| Total | Undergraduate | Graduate | |
|---|---|---|---|
| Total | 1,775 | 1,640 | 135 |
| Men | 207 | 184 | 23 |
| Women | 1,568 | 1,456 | 112 |
Student Distribution by Race/Ethnicity
| Race | Total | Men | Women |
|---|---|---|---|
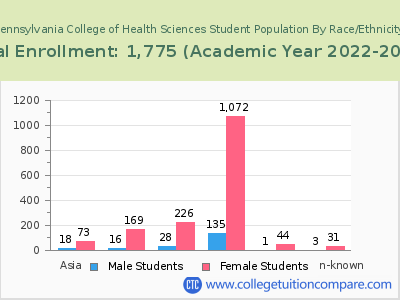
| American Indian or Native American | 2 | 0 | 2 |
| Asian | 94 | 21 | 73 |
| Black | 203 | 23 | 180 |
| Hispanic | 288 | 33 | 255 |
| Native Hawaiian or Other Pacific Islanders | 4 | 1 | 3 |
| White | 1,122 | 122 | 1,000 |
| Two or more races | 39 | 2 | 37 |
| Race Unknown | 23 | 5 | 18 |
| Race | Total | Men | Women |
|---|---|---|---|
| American Indian or Native American | 2 | 0 | 2 |
| Asian | 87 | 18 | 69 |
| Black | 193 | 21 | 172 |
| Hispanic | 279 | 31 | 248 |
| Native Hawaiian or Other Pacific Islanders | 4 | 1 | 3 |
| White | 1,017 | 107 | 910 |
| Two or more races | 36 | 1 | 35 |
| Race Unknown | 22 | 5 | 17 |
| Race | Total | Men | Women |
|---|---|---|---|
| American Indian or Native American | 0 | 0 | 0 |
| Asian | 21 | 5 | 16 |
| Black | 33 | 2 | 31 |
| Hispanic | 52 | 8 | 44 |
| Native Hawaiian or Other Pacific Islanders | 0 | 0 | 0 |
| White | 137 | 14 | 123 |
| Two or more races | 8 | 1 | 7 |
| Race Unknown | 1 | 0 | 1 |
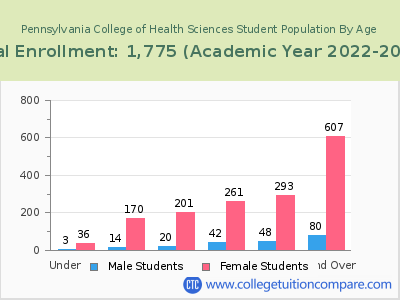
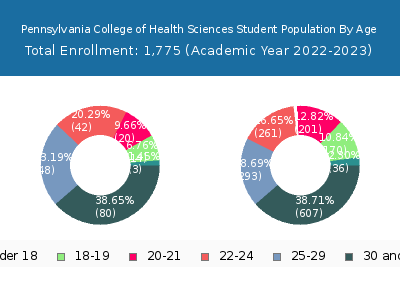
Student Age Distribution
| Age | Total | Men | Women |
|---|---|---|---|
| Under 18 | 39 | 36 | 3 |
| 18-19 | 184 | 170 | 14 |
| 20-21 | 221 | 201 | 20 |
| 22-24 | 303 | 261 | 42 |
| 25-29 | 341 | 293 | 48 |
| 30-34 | 261 | 231 | 30 |
| 35-39 | 164 | 141 | 23 |
| 40-49 | 189 | 171 | 18 |
| 50-64 | 73 | 64 | 9 |
| Age | Total | Men | Women |
|---|---|---|---|
| Under 18 | 39 | 36 | 3 |
| 18-19 | 184 | 170 | 14 |
| 20-21 | 221 | 201 | 20 |
| 22-24 | 298 | 258 | 40 |
| 25-29 | 309 | 264 | 45 |
| 30-34 | 239 | 215 | 24 |
| 35-39 | 136 | 119 | 17 |
| 40-49 | 157 | 144 | 13 |
| 50-64 | 57 | 49 | 8 |
| Age | Total | Men | Women |
|---|
Online Student Enrollment
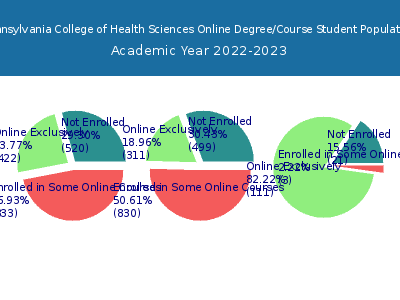
Distance learning, also called online education, is very attractive to students, especially who want to continue education and work in field. At Pennsylvania College of Health Sciences, 422 students are enrolled exclusively in online courses and 833 students are enrolled in some online courses.
403 students lived in Pennsylvania or jurisdiction in which the school is located are enrolled exclusively in online courses and 19 students live in other State or outside of the United States.
| All Students | Enrolled Exclusively Online Courses | Enrolled in Some Online Courses | |
|---|---|---|---|
| All Students | 1,775 | 422 | 833 |
| Undergraduate | 1,640 | 311 | 830 |
| Graduate | 135 | 111 | 3 |
| Pennsylvania Residents | Other States in U.S. | Outside of U.S. | |
|---|---|---|---|
| All Students | 403 | 19 | 0 |
| Undergraduate | 298 | 13 | 0 |
| Graduate | 105 | 6 | 0 |
Transfer-in Students (Undergraduate)
Among 1,640 enrolled in undergraduate programs, 252 students have transferred-in from other institutions. The percentage of transfer-in students is 15.37%.88 students have transferred in as full-time status and 164 students transferred in as part-time status.
| Number of Students | |
|---|---|
| Regular Full-time | 467 |
| Transfer-in Full-time | 88 |
| Regular Part-time | 921 |
| Transfer-in Part-time | 164 |
