Graduation Rates in Reasonable Completion Time
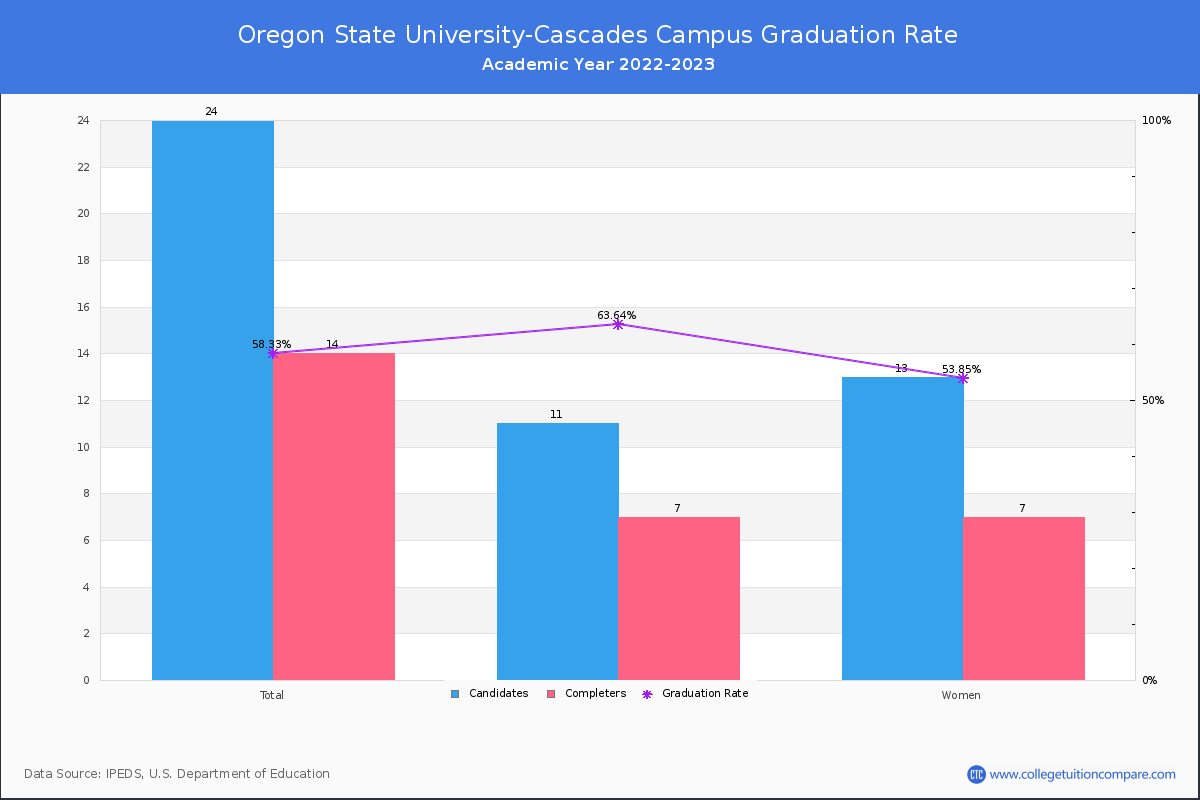
For the academic year 2022-2023, 14 students out of 24 candidates have completed their courses within 150% normal time (i.e. in 6 years for 4-year BS degree) at Oregon State University-Cascades Campus.
By gender, 7 male and 7 female students graduated the school last year completing their jobs in the period. Its graduation rate is around the average rate when comparing similar colleges' rate of 60.23% (public ).
| Candidates | Completers | Graduation Rates | |
|---|---|---|---|
| Total | 24 | 14 | 58.33% |
| Men | 11 | 7 | 63.64% |
| Women | 13 | 7 | 53.85% |
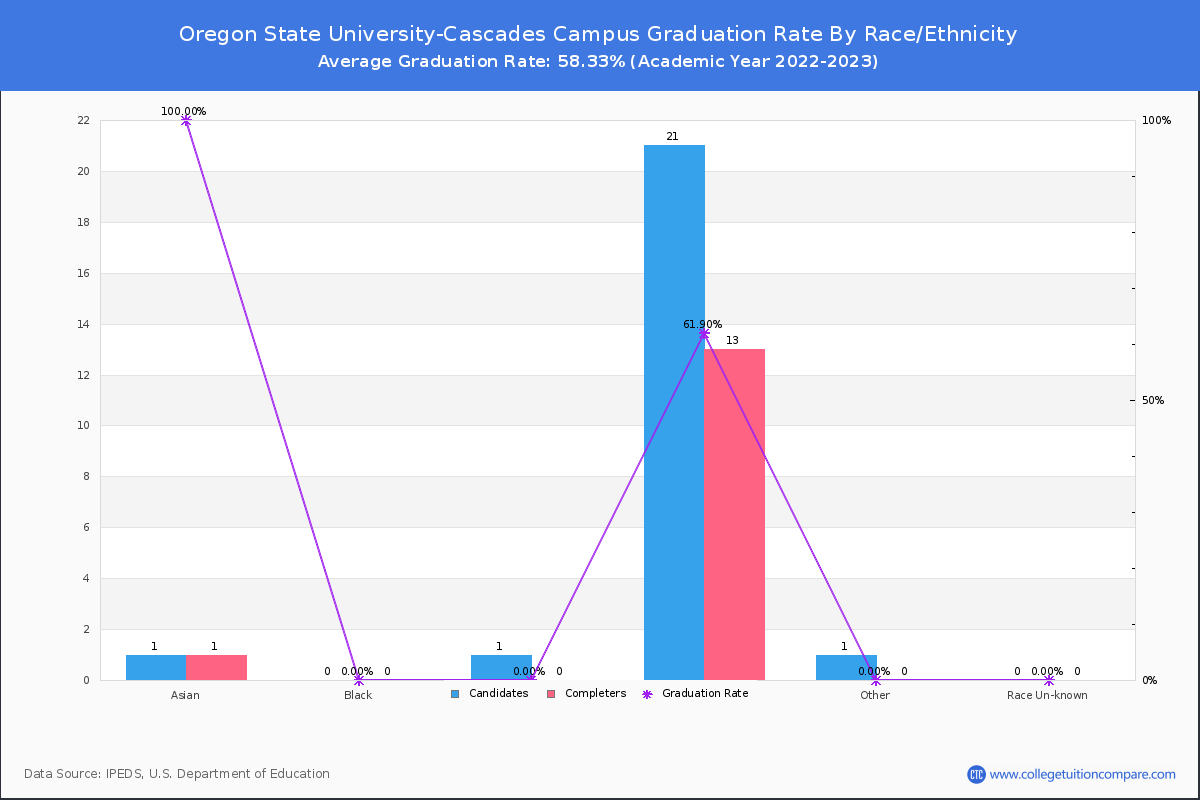
Graduation Rate By Race/Ethnicity
The following table shows graduation rate by race and at Oregon State University-Cascades Campus.
- American Indian or Alaska Native: 0.00%
- Asian: 100.00%
- Hispanic: 0.00%
- White: 61.90%
| Total | Male | Female | |
|---|---|---|---|
| American Indian or Alaska Native | 0.00%(-/1) | - | - |
| Asian | 100.00%(1/1) | 100.00%(1/1) | - |
| Hispanic | 0.00%(-/1) | - | - |
| White | 61.90%(13/21) | 66.67%(6/9) | 58.33%(7/12) |
Transfer-out and Retention Rates
At Oregon State University-Cascades Campus, the transfer-out rate is 20.83%. Its transfer-out rate is lower than the average rate when comparing similar colleges' rate of 29.18%.
Oregon State University-Cascades Campus's retention rate is 79% for full-time students and 60 % for part-time students last year. Its retention rate is around the average rate when comparing similar colleges' rate of 75.35%.