Graduation Rates in Reasonable Completion Time
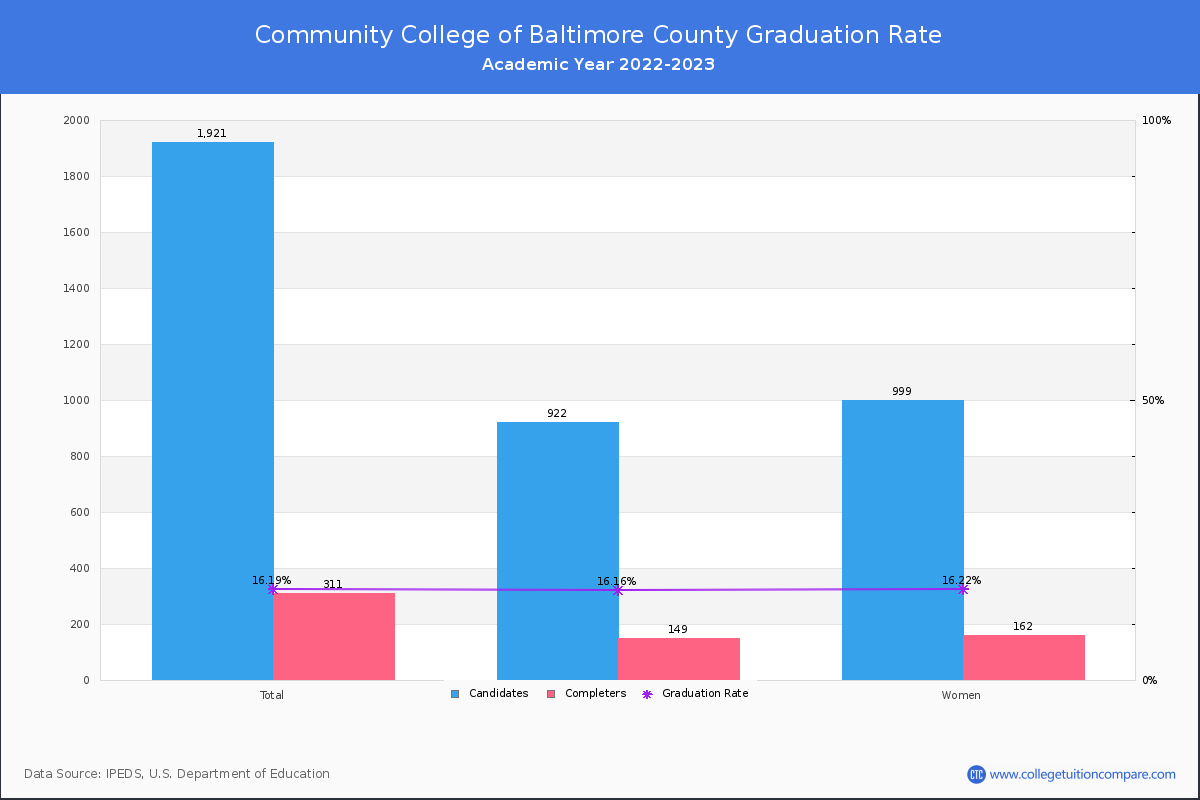
For the academic year 2022-2023, 311 students out of 1,921 candidates have completed their courses within 150% normal time (i.e. in 3 years for 2-year Associate degree) at Community College of Baltimore County.
By gender, 149 male and 162 female students graduated the school last year completing their jobs in the period. Its graduation rate is lower than the average rate when comparing similar colleges' rate of 27.23% (public suburban-serving Associate's college).
| Candidates | Completers | Graduation Rates | |
|---|---|---|---|
| Total | 1,921 | 311 | 16.19% |
| Men | 922 | 149 | 16.16% |
| Women | 999 | 162 | 16.22% |
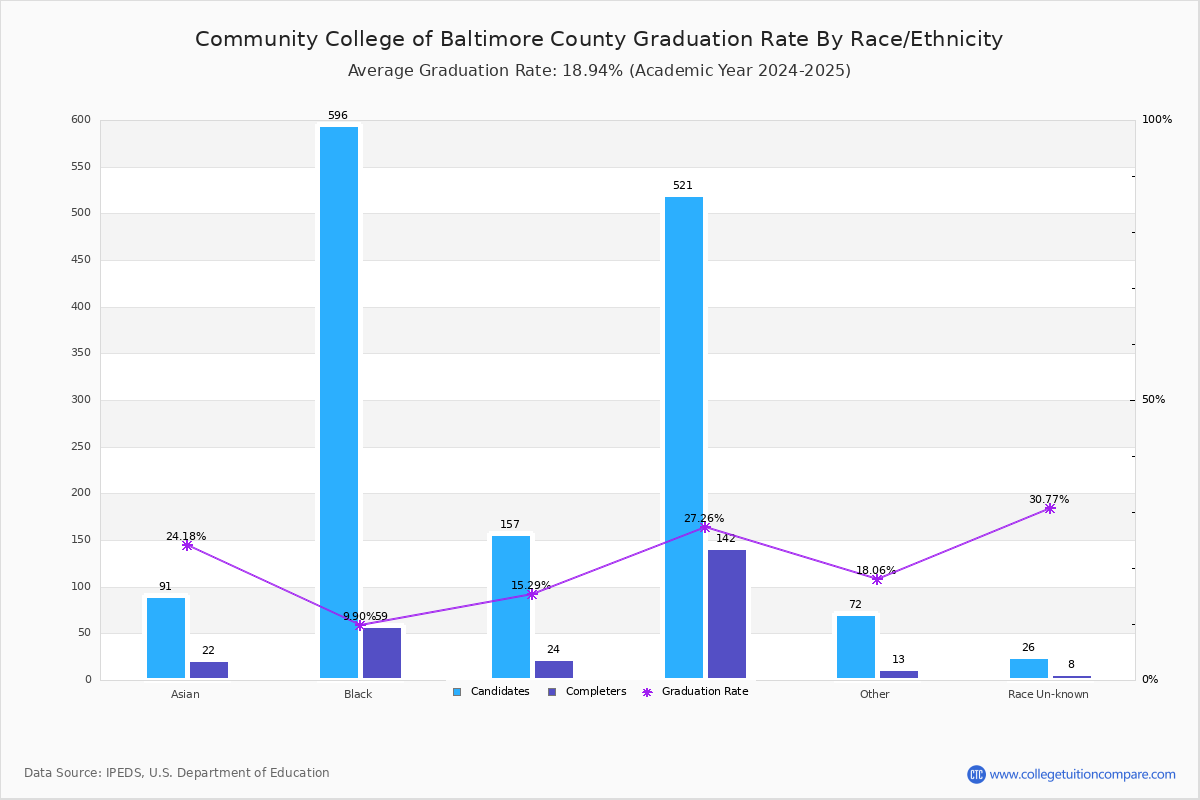
Graduation Rate By Race/Ethnicity
The following table shows graduation rate by race and at Community College of Baltimore County.
- American Indian or Alaska Native: 0.00%
- Asian: 18.33%
- Black (Non-Hispanic): 8.54%
- Hispanic: 15.95%
- White: 25.59%
- Native Hawaiian or Other Pacific Islander: 20.00%
- Two or More Race: 16.50%
- Unknown: 23.81%
| Total | Male | Female | |
|---|---|---|---|
| American Indian or Alaska Native | 0.00%(-/10) | - | - |
| Asian | 18.33%(22/120) | 19.64%(11/56) | 17.19%(11/64) |
| Black (Non-Hispanic) | 8.54%(67/785) | 7.12%(24/337) | 9.60%(43/448) |
| Hispanic | 15.95%(26/163) | 16.67%(14/84) | 15.19%(12/79) |
| White | 25.59%(142/555) | 27.46%(81/295) | 23.46%(61/260) |
| Native Hawaiian or Other Pacific Islander | 20.00%(1/5) | - | 25.00%(1/4) |
| Two or More Race | 16.50%(17/103) | 11.36%(5/44) | 20.34%(12/59) |
| Unknown | 23.81%(5/21) | 14.29%(2/14) | 42.86%(3/7) |
Transfer-out and Retention Rates
At CCBC, the transfer-out rate is 20.93%. Its transfer-out rate is higher than the average rate when comparing similar colleges' rate of 14.42%.
CCBC's retention rate is 52% for full-time students and 35 % for part-time students last year. Its retention rate is relatively lower than the average rate when comparing similar colleges' rate of 61.92%.
Non-Resident Alien Graduation Rate
A non-resident alien student is not a US citizen/green card holder and studies with a student visa, such as an F visa, in the United States. At Community College of Baltimore County, 31 of 159 non-resident alien students completed their studies and the graduation rate was 19.50%.