Student Population by Gender
Lancaster County Career and Technology Center has a total of 239 enrolled students for the academic year 2022-2023. All 239 students are enrolled into undergraduate programs.
By gender, 34 male and 205 female students (the male-female ratio is 14:86) are attending the school. The gender distribution is based on the 2022-2023 data.
| Undergraduate | |
|---|---|
| Total | 239 |
| Men | 34 |
| Women | 205 |
Student Distribution by Race/Ethnicity
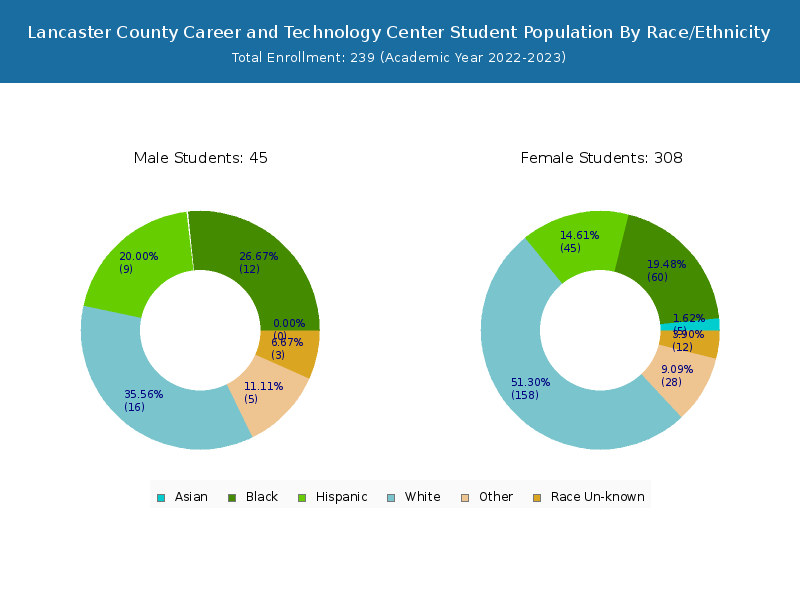
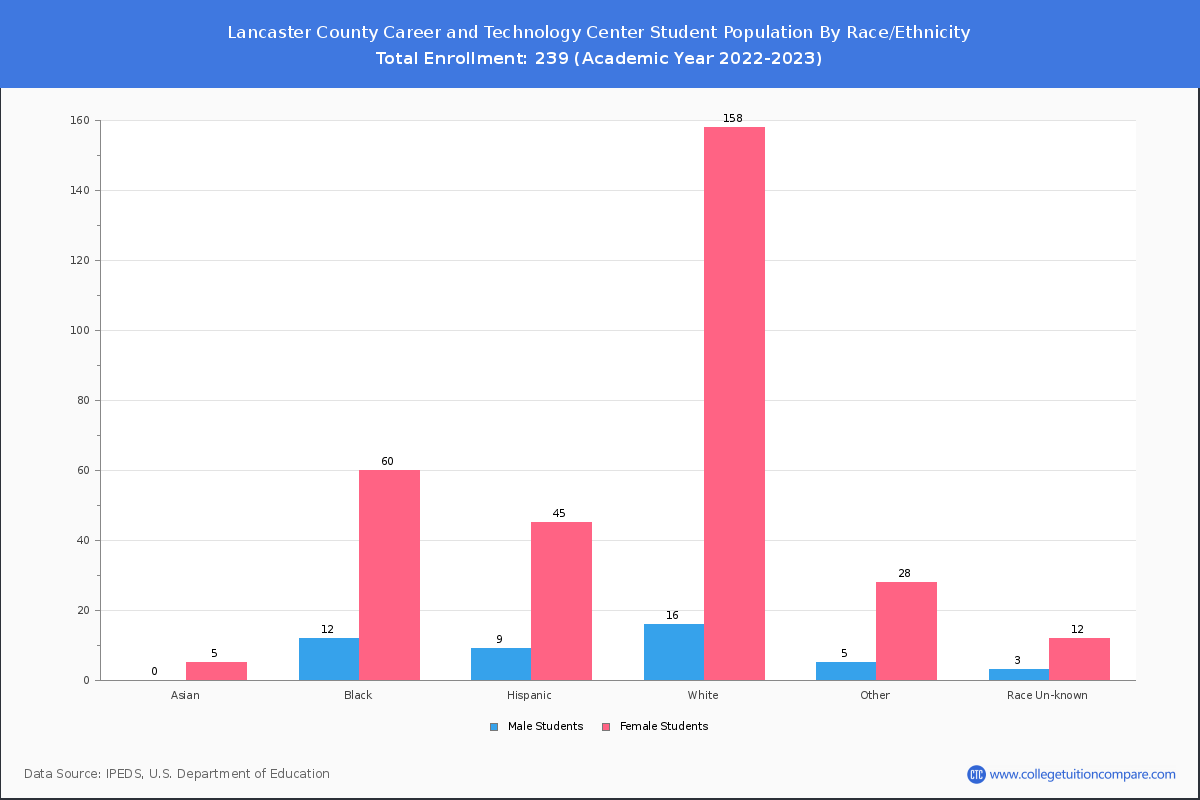
By race/ethnicity, 111 White, 52 Black, and 4 Asian students out of a total of 239 are attending at Lancaster County Career and Technology Center. Comprehensive enrollment statistic data by race/ethnicity is shown in the next chart (Academic year 2022-2023 data).
| Race | Total | Men | Women |
|---|---|---|---|
| American Indian or Native American | 0 | 0 | 0 |
| Asian | 4 | 2 | 2 |
| Black | 52 | 8 | 44 |
| Hispanic | 34 | 7 | 27 |
| Native Hawaiian or Other Pacific Islanders | 0 | 0 | 0 |
| White | 111 | 13 | 98 |
| Two or more races | 24 | 2 | 22 |
| Race Unknown | 14 | 2 | 12 |
Student Age Distribution
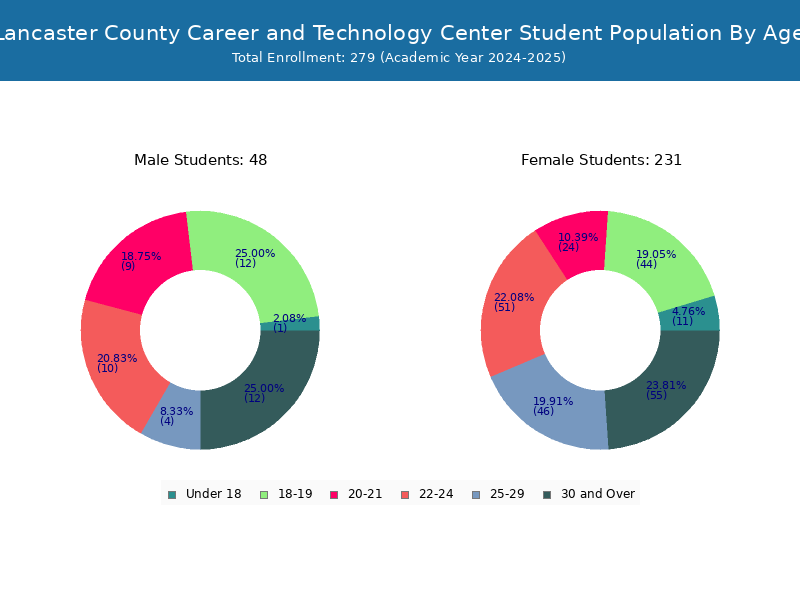
There are 136 students under 25 years old, and 103 students over 25 years old out of 239 total students.

| Age | Total | Men | Women |
|---|---|---|---|
| Under 18 | 5 | 5 | 0 |
| 18-19 | 43 | 38 | 5 |
| 20-21 | 42 | 33 | 9 |
| 22-24 | 46 | 38 | 8 |
| 25-29 | 41 | 35 | 6 |
| 30-34 | 25 | 23 | 2 |
| 35-39 | 14 | 12 | 2 |
| 40-49 | 21 | 19 | 2 |
| 50-64 | 2 | 2 | 0 |
Transfer-in Students (Undergraduate)
Among 239 enrolled in undergraduate programs, 43 students have transferred-in from other institutions. The percentage of transfer-in students is 17.99%.42 students have transferred in as full-time status and 1 students transferred in as part-time status.
| Number of Students | |
|---|---|
| Regular Full-time | 158 |
| Transfer-in Full-time | 42 |
| Regular Part-time | 38 |
| Transfer-in Part-time | 1 |