Graduation Rates in Reasonable Completion Time
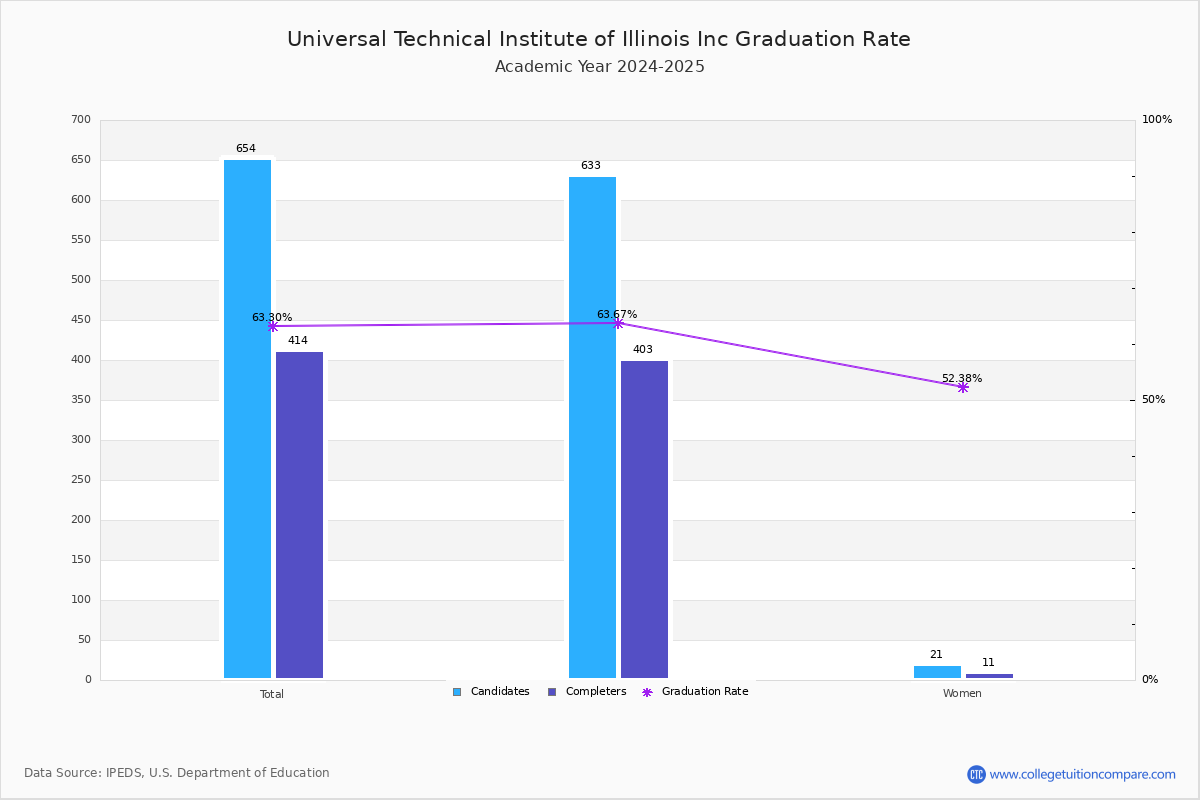
For the academic year 2022-2023, 297 students out of 597 candidates have completed their courses within 150% normal time (i.e. in 3 years for 2-year Associate degree) at Universal Technical Institute of Illinois Inc.
By gender, 290 male and 7 female students graduated the school last year completing their jobs in the period. Its graduation rate is relatively lower than the average rate when comparing similar colleges' rate of 64.87% (private (for-profit) ).
| Candidates | Completers | Graduation Rates | |
|---|---|---|---|
| Total | 597 | 297 | 49.75% |
| Men | 581 | 290 | 49.91% |
| Women | 16 | 7 | 43.75% |
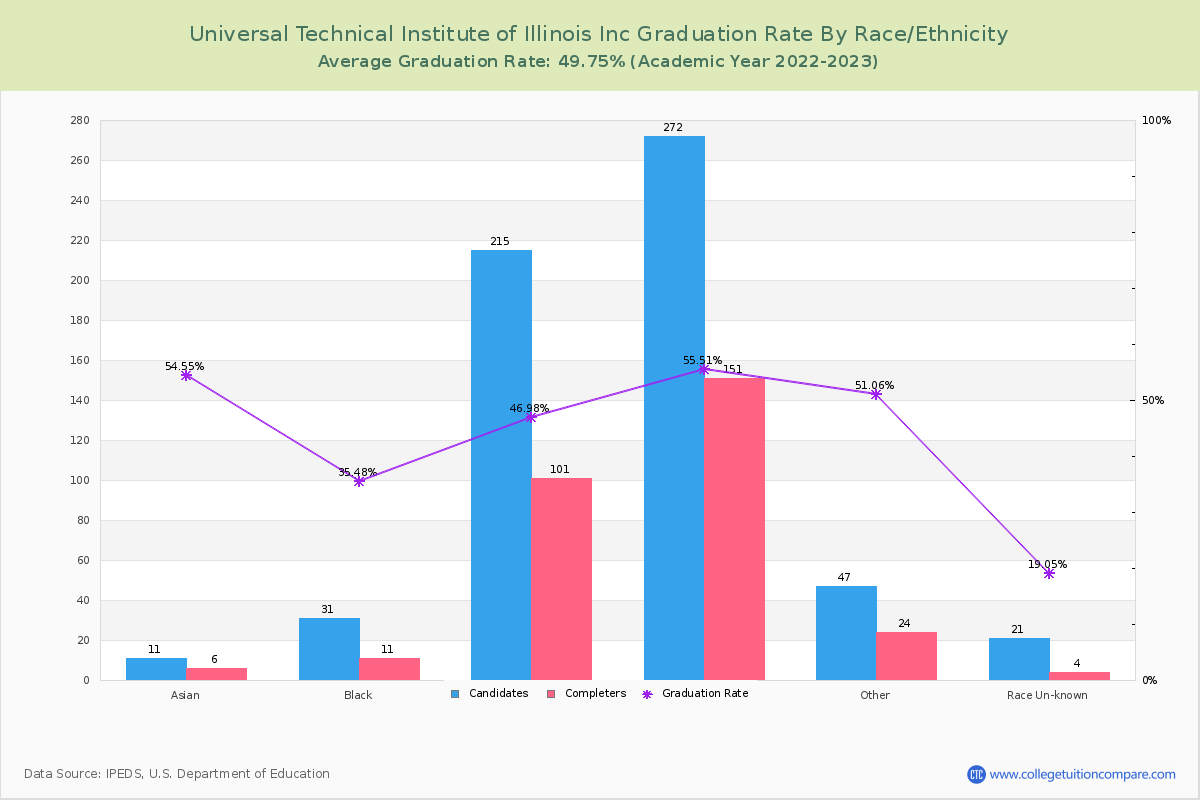
Graduation Rate By Race/Ethnicity
The following table shows graduation rate by race and at Universal Technical Institute of Illinois Inc.
- American Indian or Alaska Native: 0.00%
- Asian: 54.55%
- Black (Non-Hispanic): 35.48%
- Hispanic: 46.98%
- White: 55.51%
- Native Hawaiian or Other Pacific Islander: 100.00%
- Two or More Race: 52.27%
- Unknown: 19.05%
| Total | Male | Female | |
|---|---|---|---|
| American Indian or Alaska Native | 0.00%(-/2) | - | - |
| Asian | 54.55%(6/11) | 54.55%(6/11) | - |
| Black (Non-Hispanic) | 35.48%(11/31) | 33.33%(10/30) | 100.00%(1/1) |
| Hispanic | 46.98%(101/215) | 47.37%(99/209) | 33.33%(2/6) |
| White | 55.51%(151/272) | 56.18%(150/267) | 20.00%(1/5) |
| Native Hawaiian or Other Pacific Islander | 100.00%(1/1) | 100.00%(1/1) | - |
| Two or More Race | 52.27%(23/44) | 50.00%(20/40) | 75.00%(3/4) |
| Unknown | 19.05%(4/21) | 19.05%(4/21) | - |
Transfer-out and Retention Rates
At UTI IL, the transfer-out rate is 0.50%.
UTI IL's retention rate is 66% last year. Its retention rate is relatively lower than the average rate when comparing similar colleges' rate of 76.45%.