Student Population by Gender
Chippewa Valley Technical College has a total of 8,364 enrolled students for the academic year 2022-2023. All 8,364 students are enrolled into undergraduate programs.
By gender, 3,764 male and 4,600 female students (the male-female ratio is 45:55) are attending the school. The gender distribution is based on the 2022-2023 data.
| Undergraduate | |
|---|---|
| Total | 8,364 |
| Men | 3,764 |
| Women | 4,600 |
Student Distribution by Race/Ethnicity
| Race | Total | Men | Women |
|---|---|---|---|
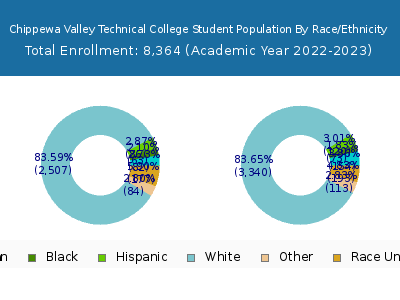
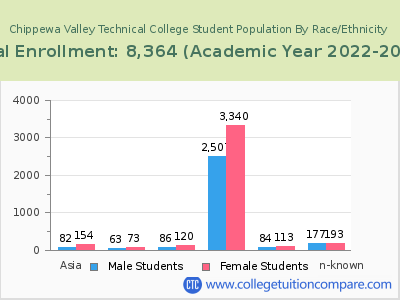
| American Indian or Native American | 67 | 29 | 38 |
| Asian | 305 | 115 | 190 |
| Black | 180 | 87 | 93 |
| Hispanic | 323 | 137 | 186 |
| Native Hawaiian or Other Pacific Islanders | 13 | 8 | 5 |
| White | 6,887 | 3,096 | 3,791 |
| Two or more races | 183 | 86 | 97 |
| Race Unknown | 400 | 204 | 196 |
Online Student Enrollment
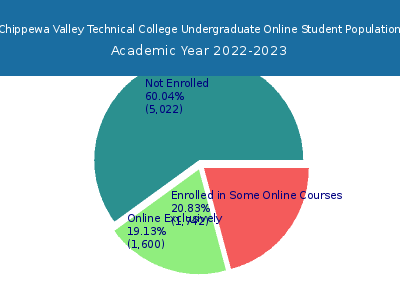
Distance learning, also called online education, is very attractive to students, especially who want to continue education and work in field. At Chippewa Valley Technical College, 1,600 students are enrolled exclusively in online courses and 1,742 students are enrolled in some online courses.
1,519 students lived in Wisconsin or jurisdiction in which the school is located are enrolled exclusively in online courses and 81 students live in other State or outside of the United States.
| All Students | Enrolled Exclusively Online Courses | Enrolled in Some Online Courses | |
|---|---|---|---|
| All Students | 8,364 | 1,600 | 1,742 |
| Undergraduate | 8,364 | 1,600 | 1,742 |
| Wisconsin Residents | Other States in U.S. | Outside of U.S. | |
|---|---|---|---|
| All Students | 1,519 | 81 | 0 |
| Undergraduate | 1,519 | 81 | 0 |
| Graduate | - | - | - |
Transfer-in Students (Undergraduate)
Among 8,364 enrolled in undergraduate programs, 324 students have transferred-in from other institutions. The percentage of transfer-in students is 3.87%.146 students have transferred in as full-time status and 178 students transferred in as part-time status.
| Number of Students | |
|---|---|
| Regular Full-time | 1,973 |
| Transfer-in Full-time | 146 |
| Regular Part-time | 6,067 |
| Transfer-in Part-time | 178 |


