Student Population by Gender
Sweet Briar College has a total of 460 enrolled students for the academic year 2022-2023. 457 students have enrolled in undergraduate programs and 3 students joined graduate programs.
By gender, all enrolled students are female at the school. The gender distribution is based on the 2022-2023 data.
| Total | Undergraduate | Graduate | |
|---|---|---|---|
| Total | 460 | 457 | 3 |
| Men | 0 | 0 | 0 |
| Women | 460 | 457 | 3 |


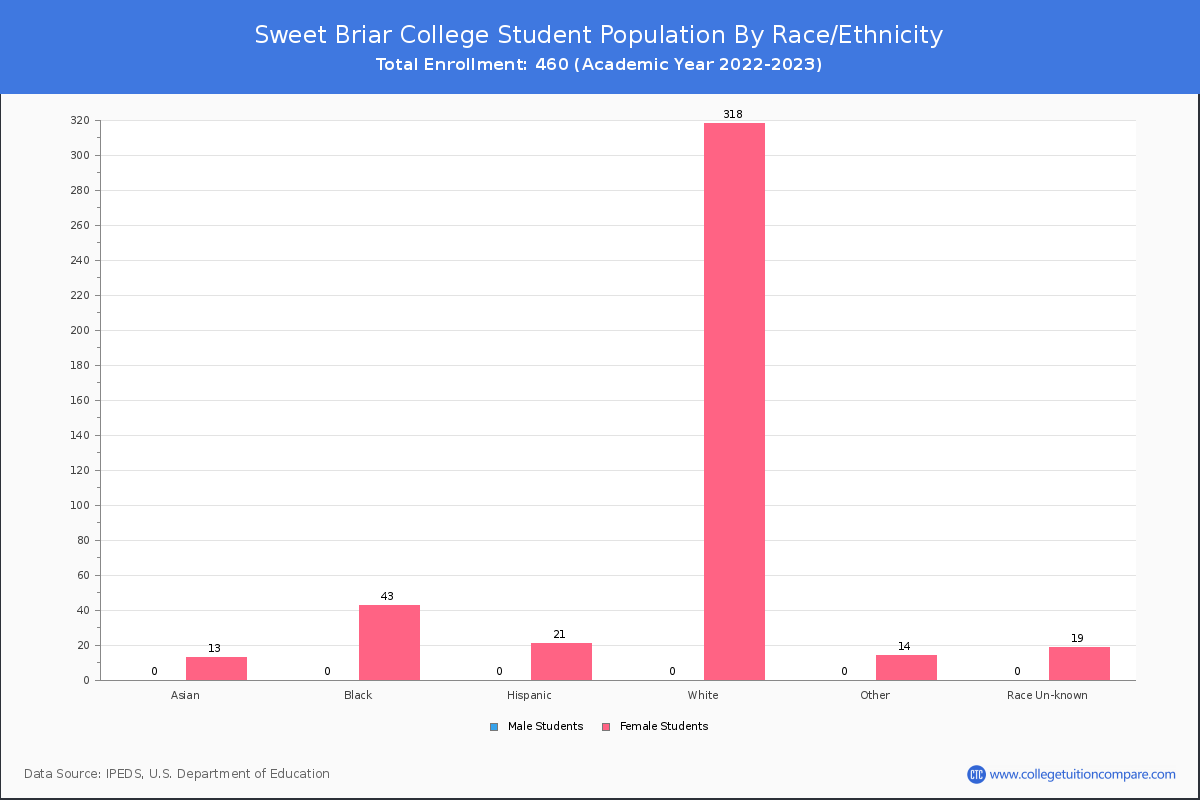
Student Distribution by Race/Ethnicity
By race/ethnicity, 314 White, 38 Black, and 12 Asian students out of a total of 460 are attending at Sweet Briar College. Comprehensive enrollment statistic data by race/ethnicity is shown in the next chart (Academic year 2022-2023 data).
| Race | Total | Men | Women |
|---|---|---|---|
| American Indian or Native American | 4 | 0 | 4 |
| Asian | 12 | 0 | 12 |
| Black | 38 | 0 | 38 |
| Hispanic | 21 | 0 | 21 |
| Native Hawaiian or Other Pacific Islanders | 0 | 0 | 0 |
| White | 314 | 0 | 314 |
| Two or more races | 6 | 0 | 6 |
| Race Unknown | 24 | 0 | 24 |
| Race | Total | Men | Women |
|---|---|---|---|
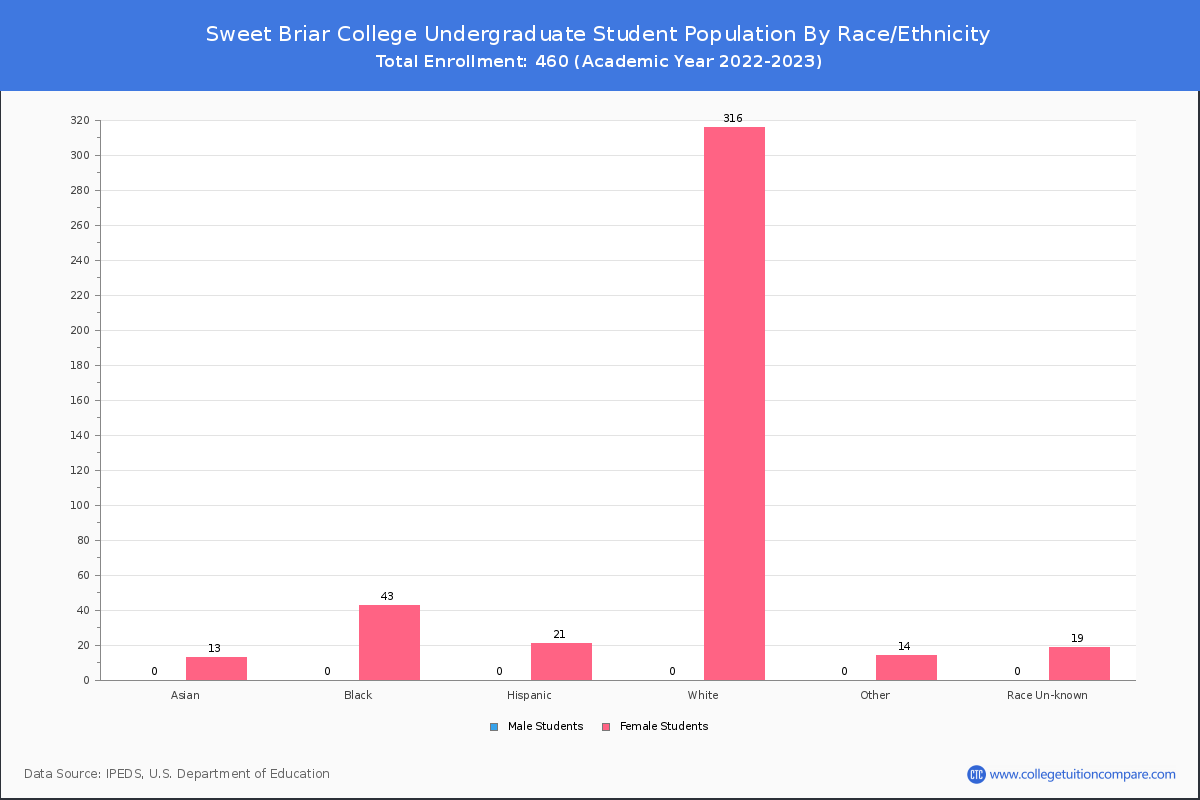
| American Indian or Native American | 4 | 0 | 4 |
| Asian | 12 | 0 | 12 |
| Black | 38 | 0 | 38 |
| Hispanic | 21 | 0 | 21 |
| Native Hawaiian or Other Pacific Islanders | 0 | 0 | 0 |
| White | 312 | 0 | 312 |
| Two or more races | 6 | 0 | 6 |
| Race Unknown | 23 | 0 | 23 |
| Race | Total | Men | Women |
|---|---|---|---|
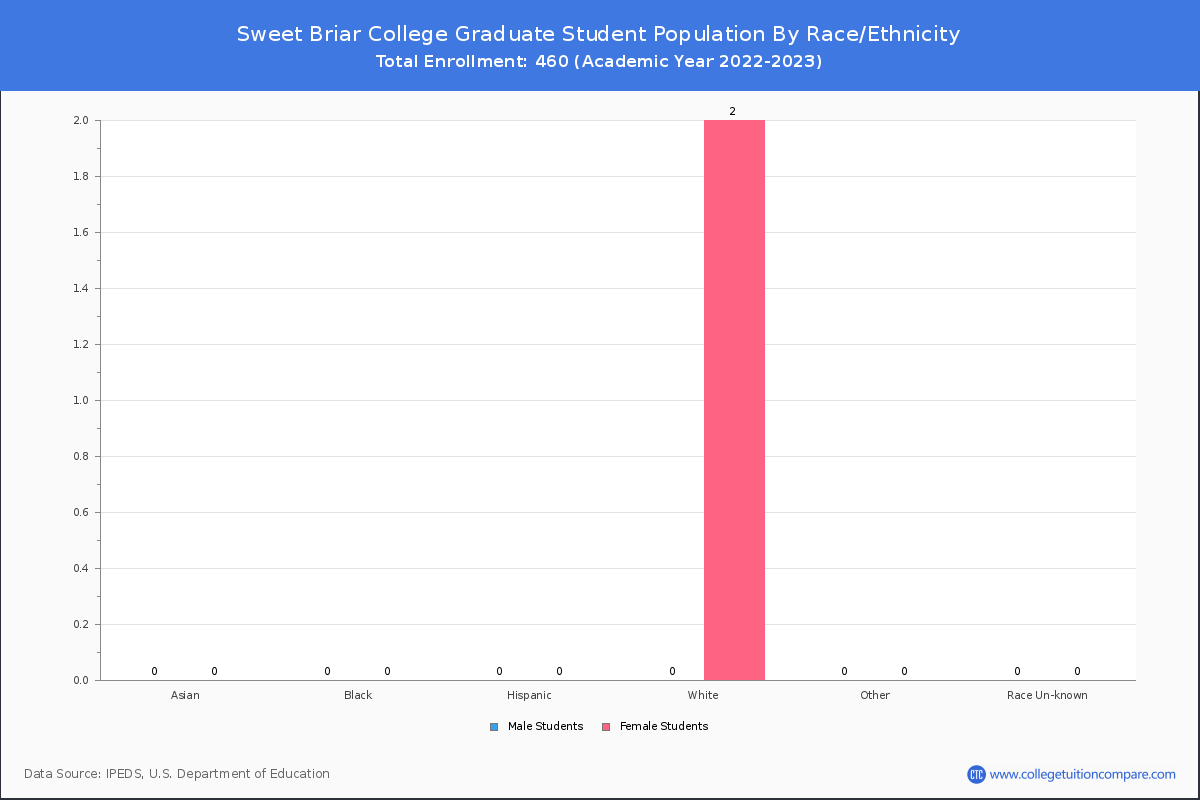
| American Indian or Native American | 0 | 0 | 0 |
| Asian | 1 | 0 | 1 |
| Black | 0 | 0 | 0 |
| Hispanic | 0 | 0 | 0 |
| Native Hawaiian or Other Pacific Islanders | 0 | 0 | 0 |
| White | 10 | 0 | 10 |
| Two or more races | 0 | 0 | 0 |
| Race Unknown | 3 | 0 | 3 |
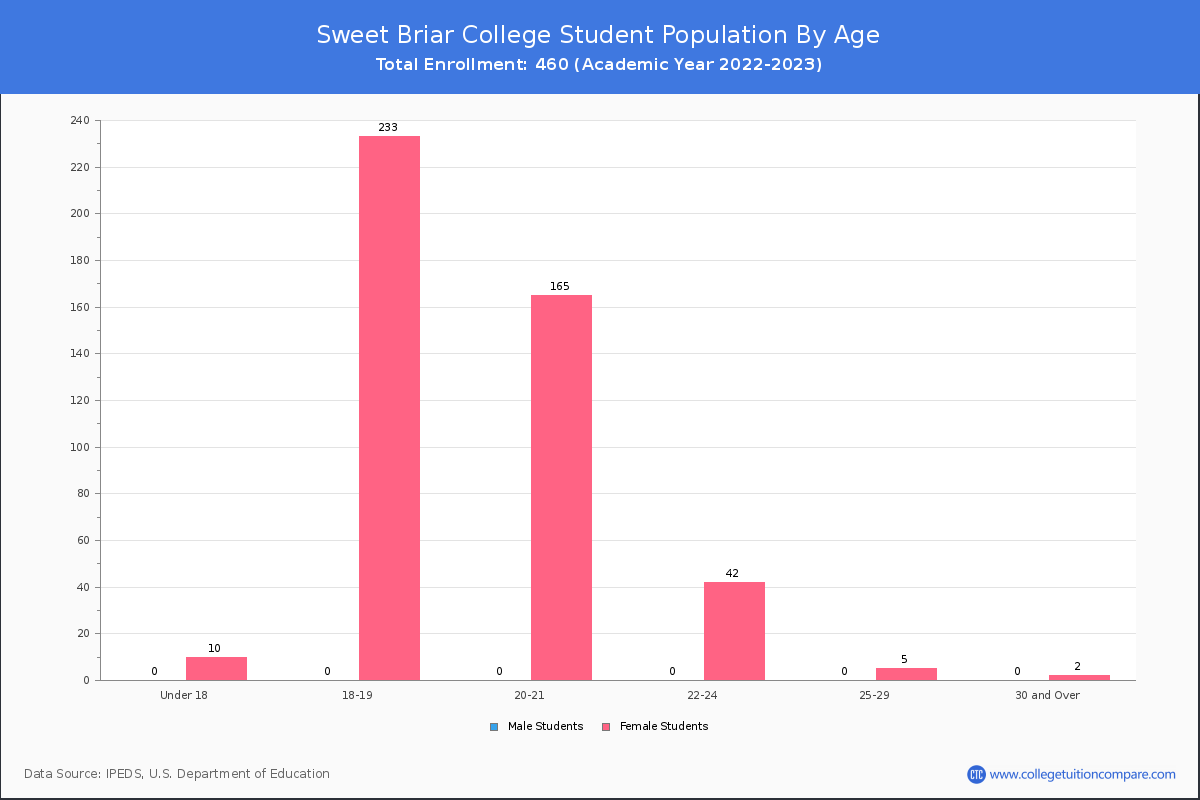
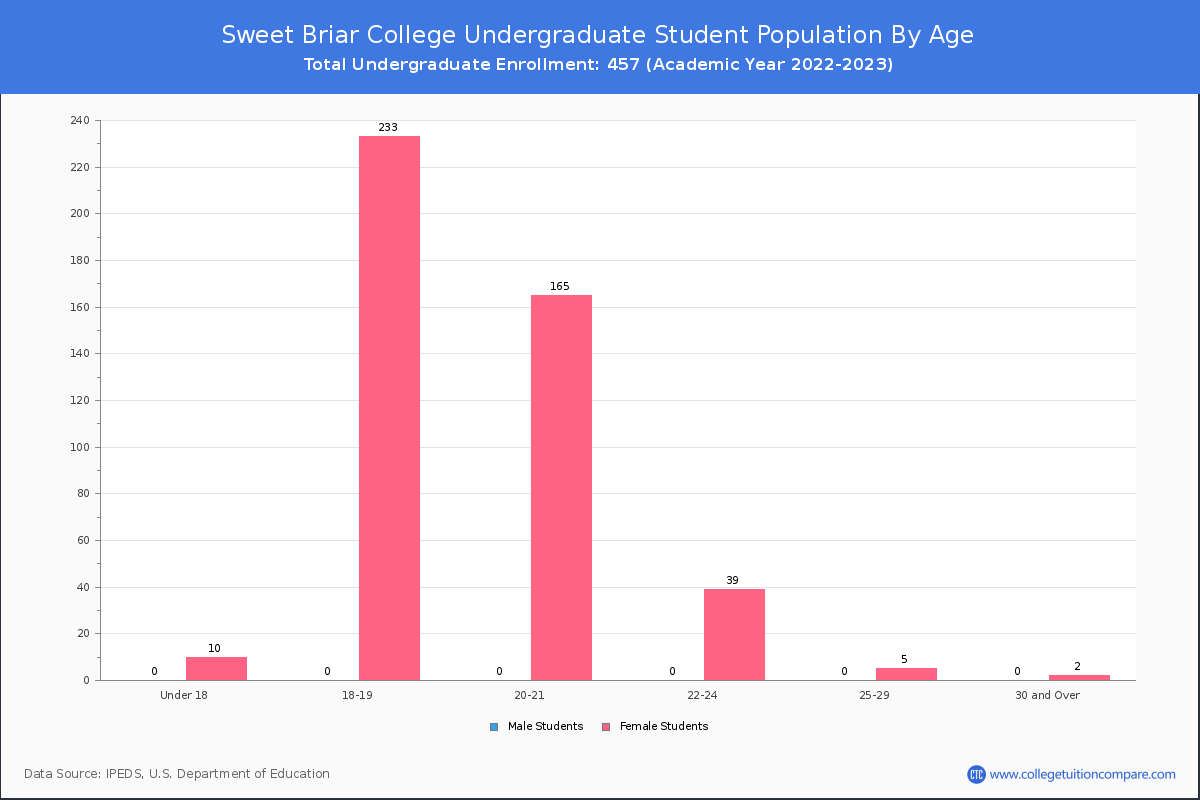
Student Age Distribution
There are 450 students under 25 years old, and 7 students over 25 years old out of 460 total students.
Sweet Briar has 447 undergraduate students aged under 25 and 7 students aged 25 and over.
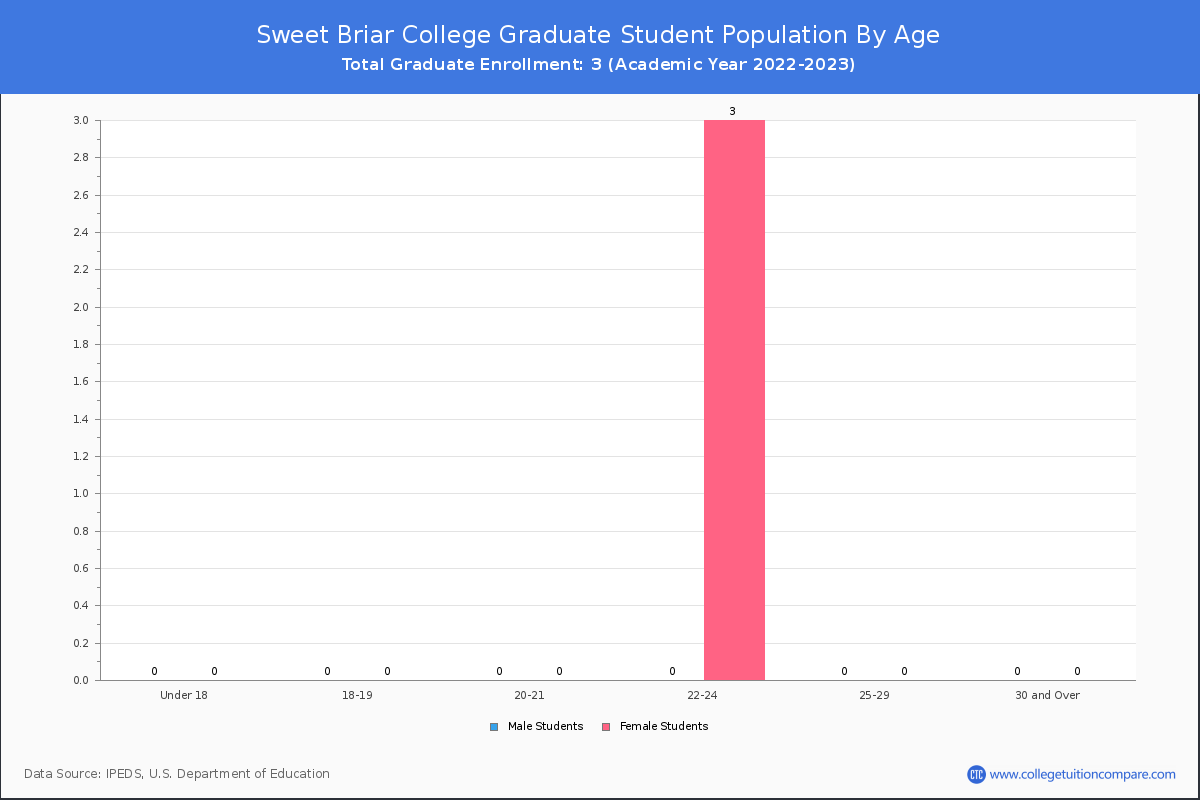
All graduate students at Sweet Briar is aged under 25.


| Age | Total | Men | Women |
|---|---|---|---|
| Under 18 | 10 | 10 | 0 |
| 18-19 | 233 | 233 | 0 |
| 20-21 | 165 | 165 | 0 |
| 22-24 | 42 | 42 | 0 |
| 25-29 | 5 | 5 | 0 |
| 30-34 | 1 | 1 | 0 |
| Age | Total | Men | Women |
|---|---|---|---|
| Under 18 | 10 | 10 | 0 |
| 18-19 | 233 | 233 | 0 |
| 20-21 | 165 | 165 | 0 |
| 22-24 | 39 | 39 | 0 |
| 25-29 | 5 | 5 | 0 |
| 30-34 | 1 | 1 | 0 |
| Age | Total | Men | Women |
|---|
Transfer-in Students (Undergraduate)
Among 457 enrolled in undergraduate programs, 15 students have transferred-in from other institutions. The percentage of transfer-in students is 3.28%.
| Number of Students | |
|---|---|
| Regular Full-time | 435 |
| Transfer-in Full-time | 15 |