Student Population by Gender
Christopher Newport University has a total of 4,559 enrolled students for the academic year 2022-2023. 4,449 students have enrolled in undergraduate programs and 110 students joined graduate programs.
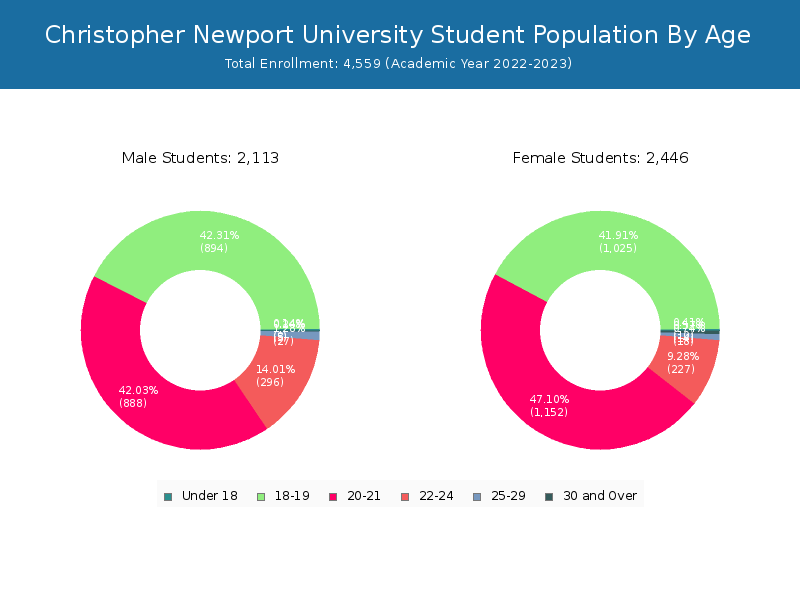
By gender, 2,113 male and 2,446 female students (the male-female ratio is 46:54) are attending the school. The gender distribution is based on the 2022-2023 data.
| Total | Undergraduate | Graduate | |
|---|---|---|---|
| Total | 4,559 | 4,449 | 110 |
| Men | 2,113 | 2,067 | 46 |
| Women | 2,446 | 2,382 | 64 |
Student Distribution by Race/Ethnicity
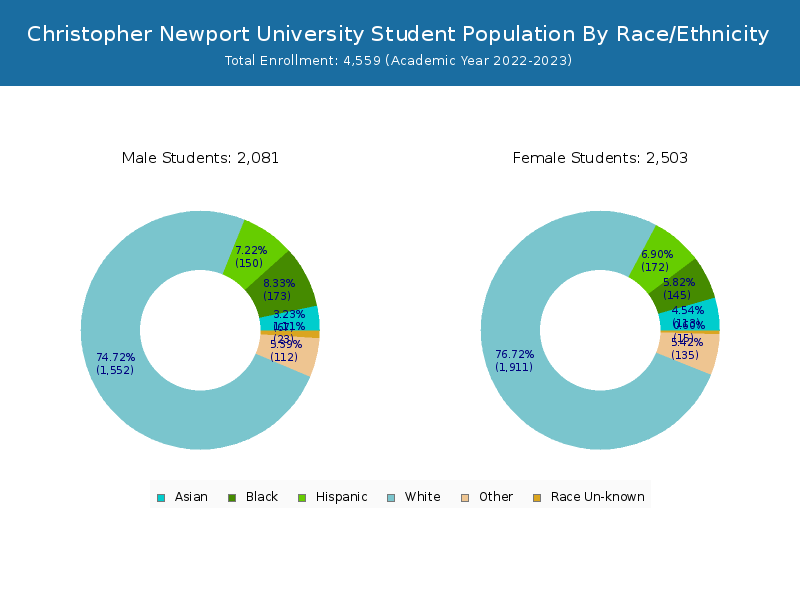
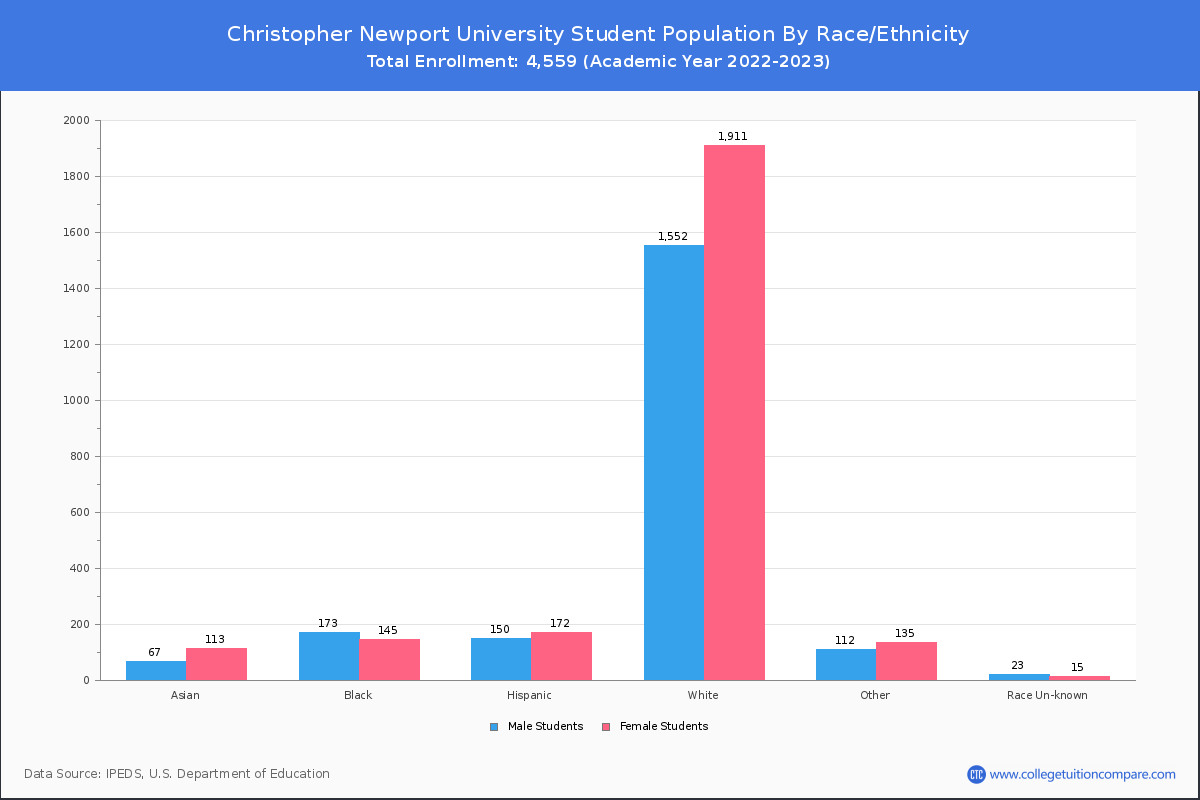
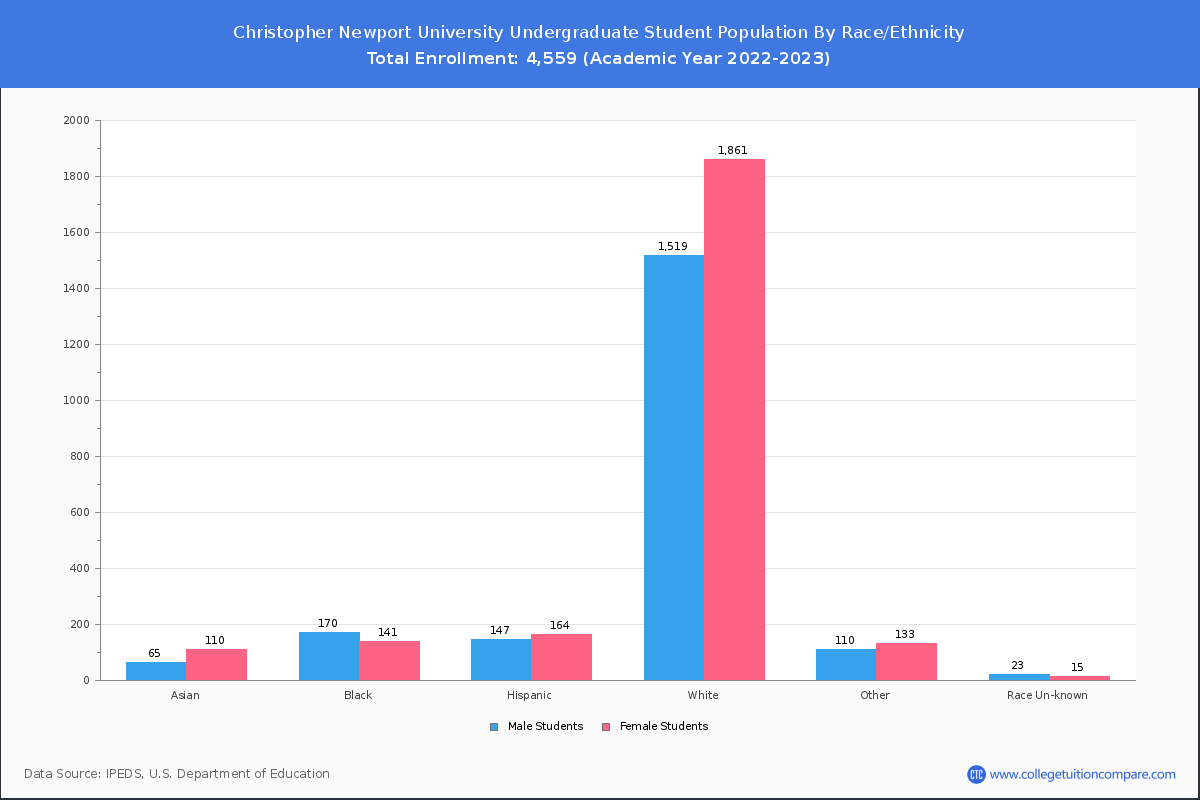
By race/ethnicity, 3,369 White, 359 Black, and 184 Asian students out of a total of 4,559 are attending at Christopher Newport University. Comprehensive enrollment statistic data by race/ethnicity is shown in the next chart (Academic year 2022-2023 data).
| Race | Total | Men | Women |
|---|---|---|---|
| American Indian or Native American | 3 | 1 | 2 |
| Asian | 184 | 67 | 117 |
| Black | 359 | 193 | 166 |
| Hispanic | 349 | 146 | 203 |
| Native Hawaiian or Other Pacific Islanders | 5 | 2 | 3 |
| White | 3,369 | 1,571 | 1,798 |
| Two or more races | 231 | 104 | 127 |
| Race Unknown | 42 | 24 | 18 |
| Race | Total | Men | Women |
|---|---|---|---|
| American Indian or Native American | 3 | 1 | 2 |
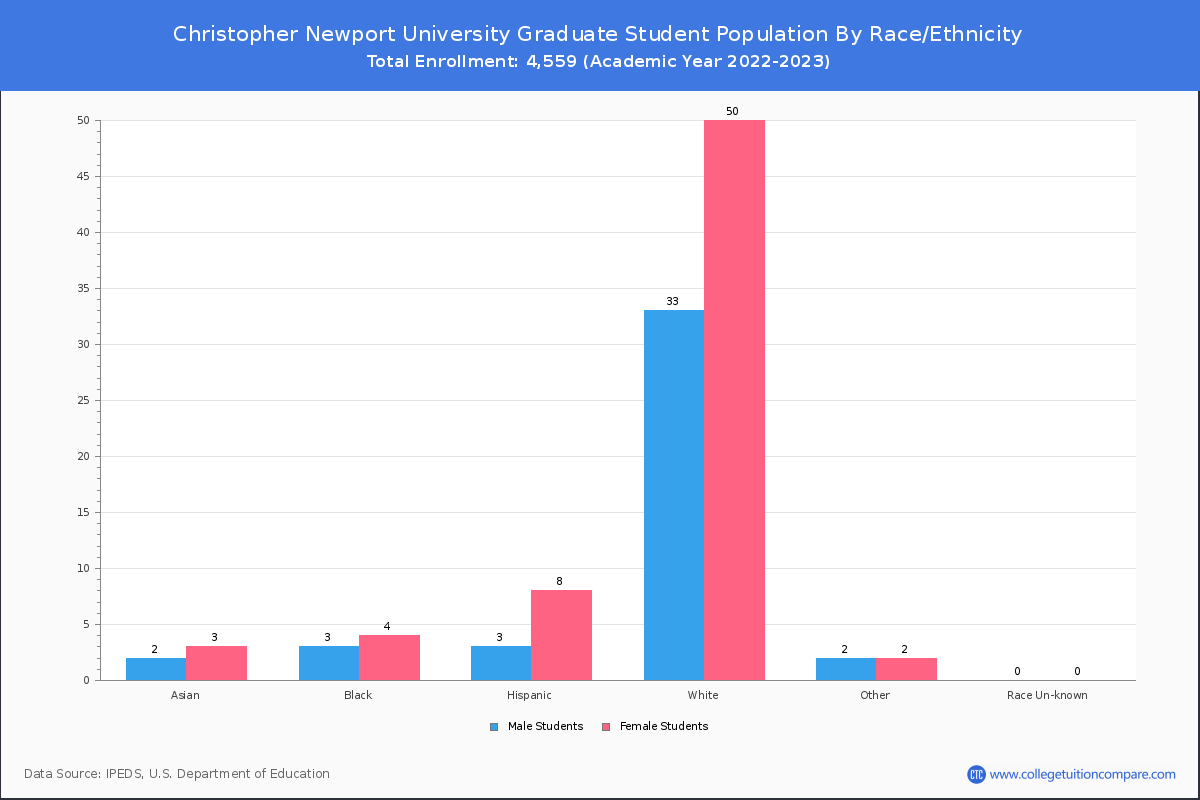
| Asian | 179 | 64 | 115 |
| Black | 356 | 192 | 164 |
| Hispanic | 338 | 141 | 197 |
| Native Hawaiian or Other Pacific Islanders | 5 | 2 | 3 |
| White | 3,289 | 1,540 | 1,749 |
| Two or more races | 224 | 99 | 125 |
| Race Unknown | 39 | 24 | 15 |
| Race | Total | Men | Women |
|---|---|---|---|
| American Indian or Native American | 0 | 0 | 0 |
| Asian | 5 | 2 | 3 |
| Black | 14 | 6 | 8 |
| Hispanic | 14 | 5 | 9 |
| Native Hawaiian or Other Pacific Islanders | 0 | 0 | 0 |
| White | 100 | 53 | 47 |
| Two or more races | 5 | 3 | 2 |
| Race Unknown | 3 | 2 | 1 |
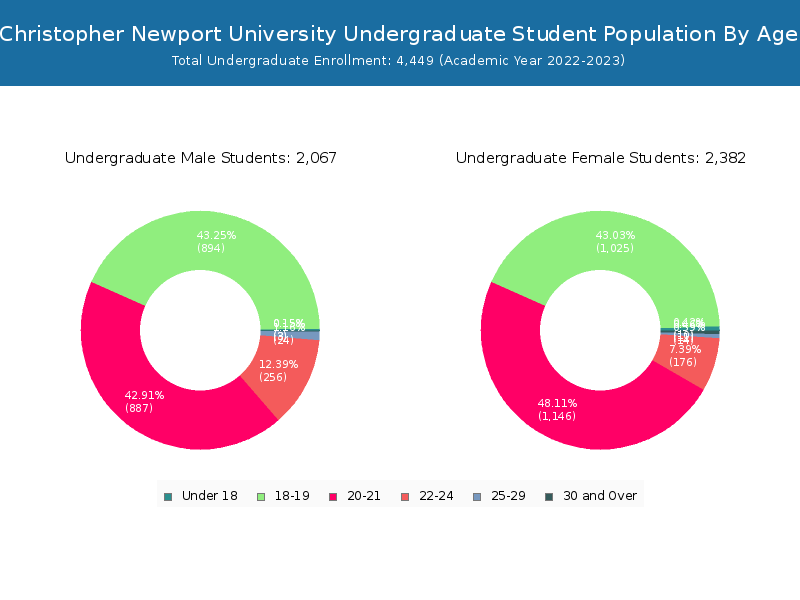
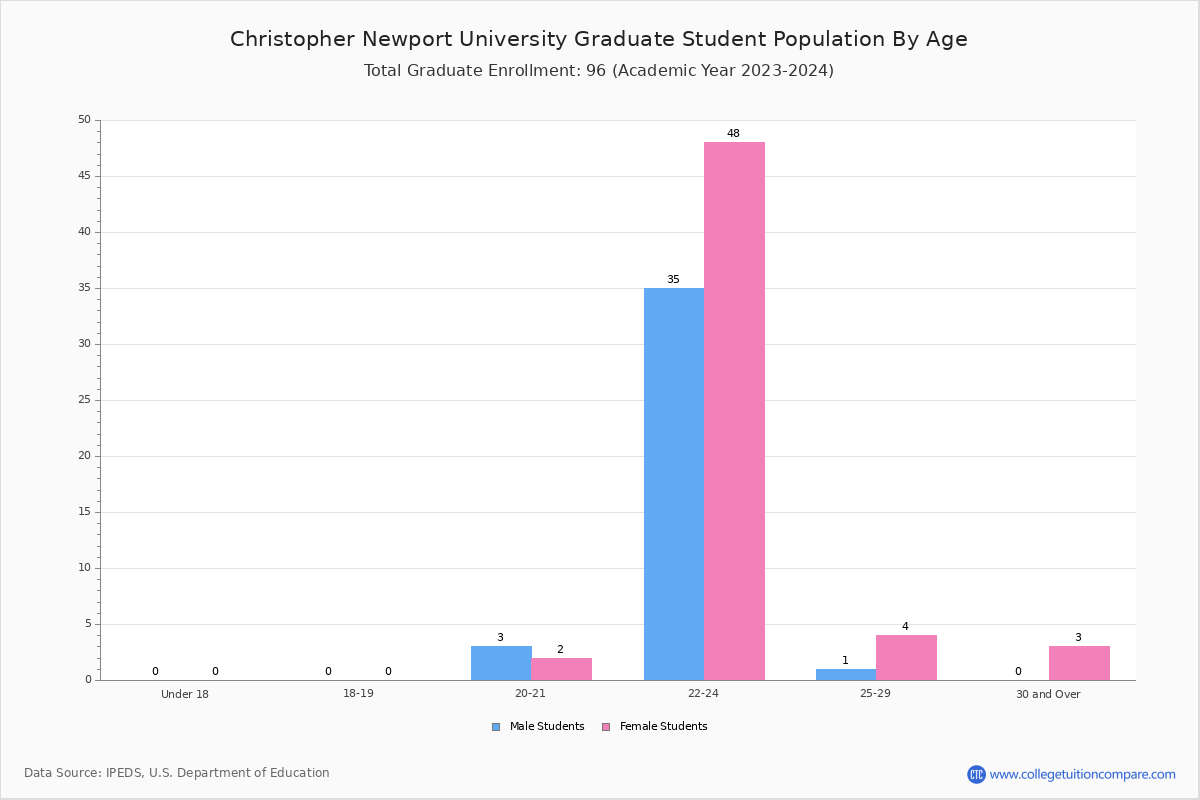
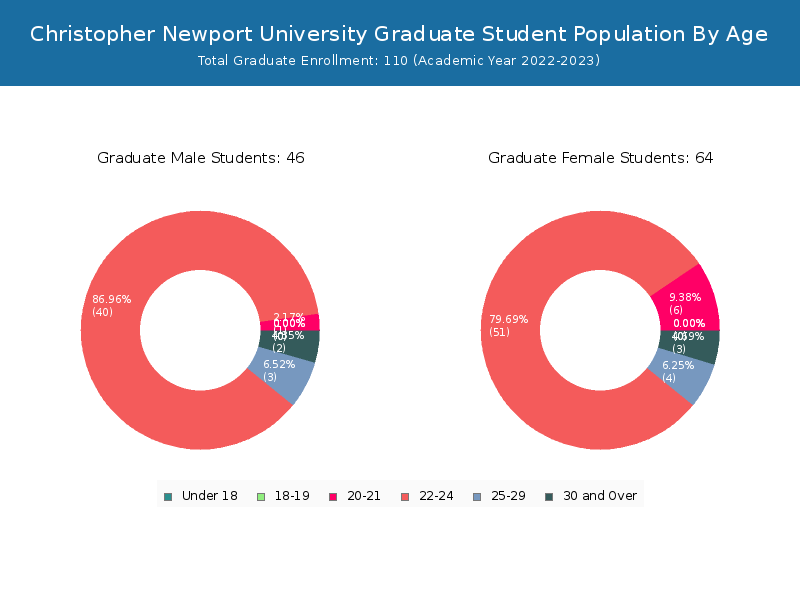
Student Age Distribution
By age, CNU has 13 students under 18 years old and 2 students over 65 years old. There are 4,495 students under 25 years old, and 64 students over 25 years old out of 4,559 total students.
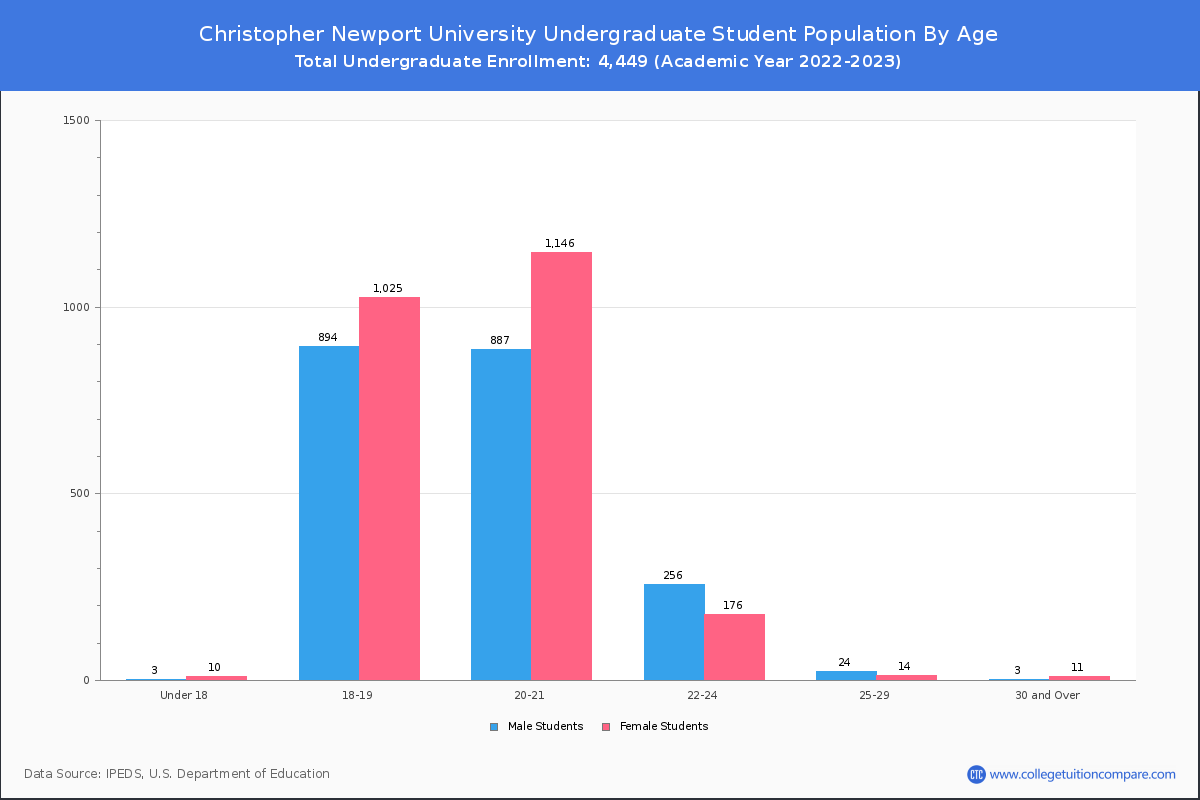
In undergraduate programs, 13 students are younger than 18 and 2 students are older than 65. CNU has 4,397 undergraduate students aged under 25 and 52 students aged 25 and over.
It has 98 graduate students aged under 25 and 12 students aged 25 and over.

| Age | Total | Men | Women |
|---|---|---|---|
| Under 18 | 13 | 10 | 3 |
| 18-19 | 1,919 | 1,025 | 894 |
| 20-21 | 2,040 | 1,152 | 888 |
| 22-24 | 523 | 227 | 296 |
| 25-29 | 45 | 18 | 27 |
| 30-34 | 12 | 10 | 2 |
| Age | Total | Men | Women |
|---|---|---|---|
| Under 18 | 13 | 10 | 3 |
| 18-19 | 1,919 | 1,025 | 894 |
| 20-21 | 2,033 | 1,146 | 887 |
| 22-24 | 432 | 176 | 256 |
| 25-29 | 38 | 14 | 24 |
| 30-34 | 9 | 8 | 1 |
| Age | Total | Men | Women |
|---|
Transfer-in Students (Undergraduate)
Among 4,449 enrolled in undergraduate programs, 144 students have transferred-in from other institutions. The percentage of transfer-in students is 3.24%.
| Number of Students | |
|---|---|
| Regular Full-time | 4,203 |
| Transfer-in Full-time | 144 |