Student Population by Gender
Wofford College has a total of 1,823 enrolled students for the academic year 2022-2023. All 1,823 students are enrolled into undergraduate programs.
By gender, 870 male and 953 female students (the male-female ratio is 48:52) are attending the school. The gender distribution is based on the 2022-2023 data.
| Undergraduate | |
|---|---|
| Total | 1,823 |
| Men | 870 |
| Women | 953 |
Student Distribution by Race/Ethnicity
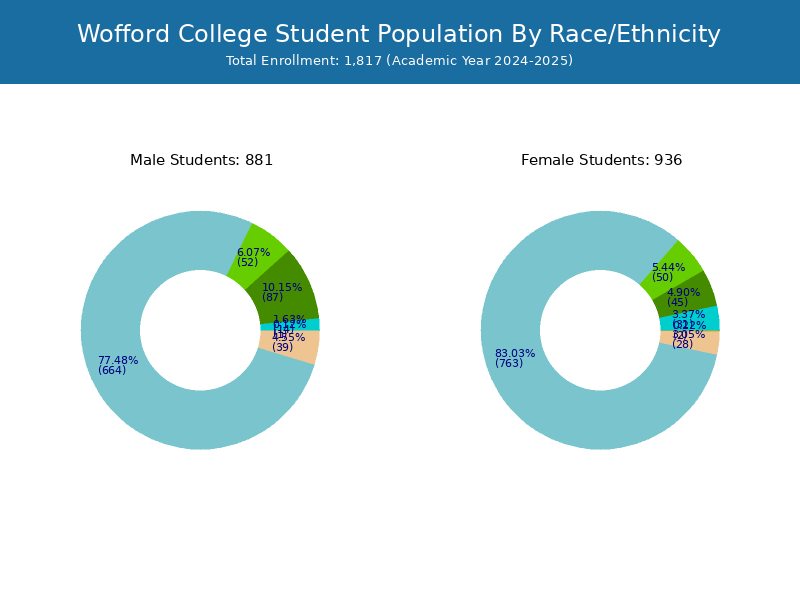
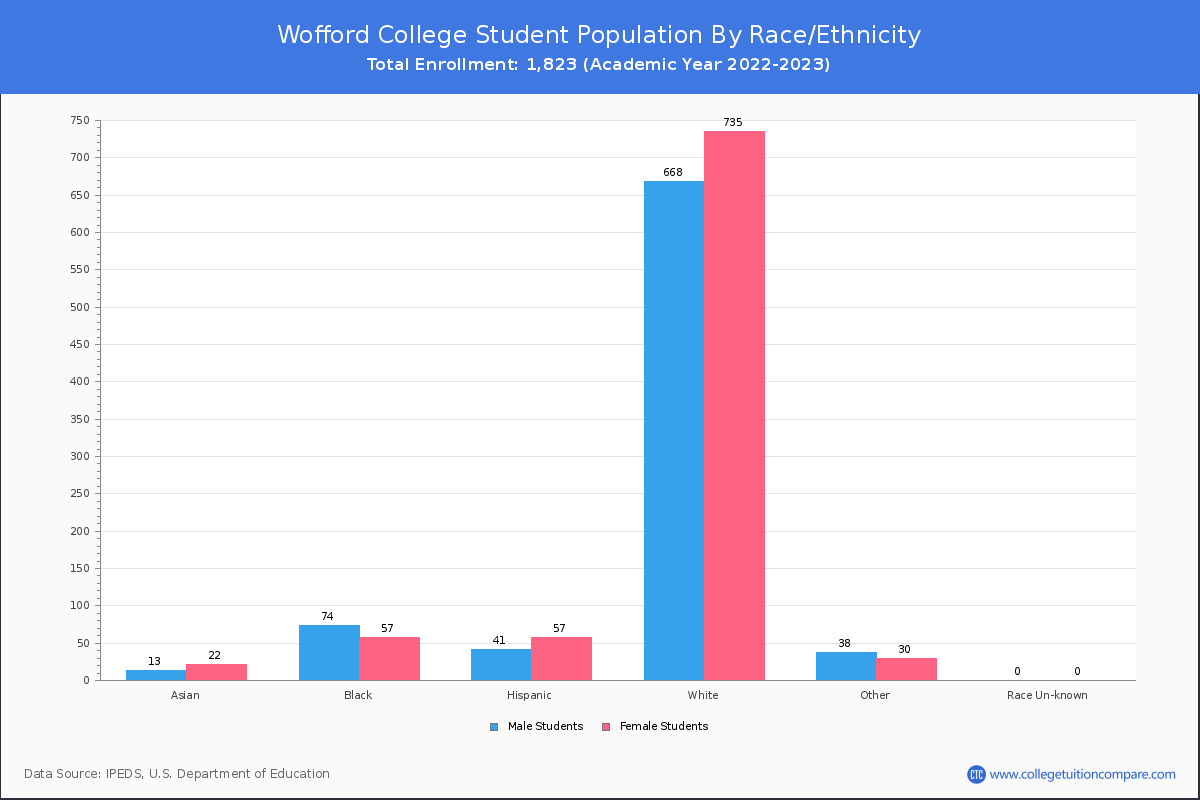
By race/ethnicity, 1,457 White, 121 Black, and 39 Asian students out of a total of 1,823 are attending at Wofford College. Comprehensive enrollment statistic data by race/ethnicity is shown in the next chart (Academic year 2022-2023 data).
| Race | Total | Men | Women |
|---|---|---|---|
| American Indian or Native American | 6 | 4 | 2 |
| Asian | 39 | 13 | 26 |
| Black | 121 | 78 | 43 |
| Hispanic | 103 | 42 | 61 |
| Native Hawaiian or Other Pacific Islanders | 0 | 0 | 0 |
| White | 1,457 | 679 | 778 |
| Two or more races | 64 | 33 | 31 |
| Race Unknown | 0 | 0 | 0 |
Student Age Distribution
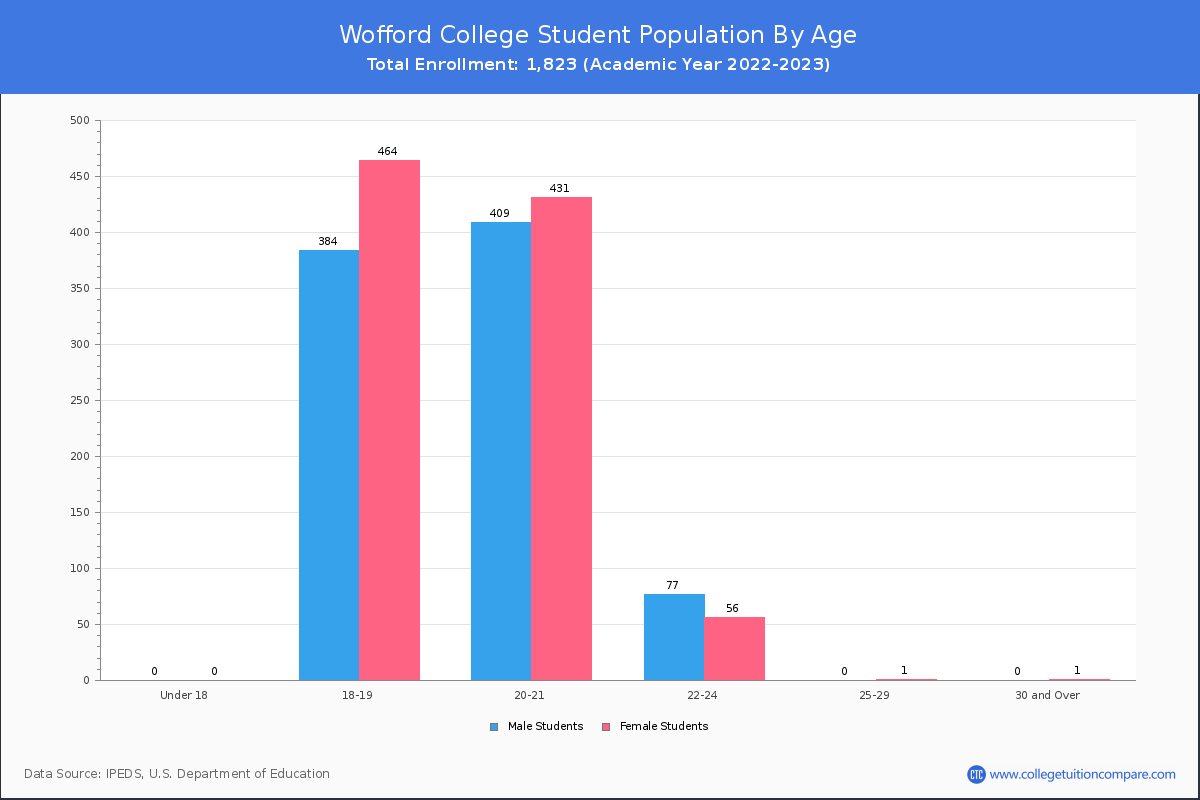
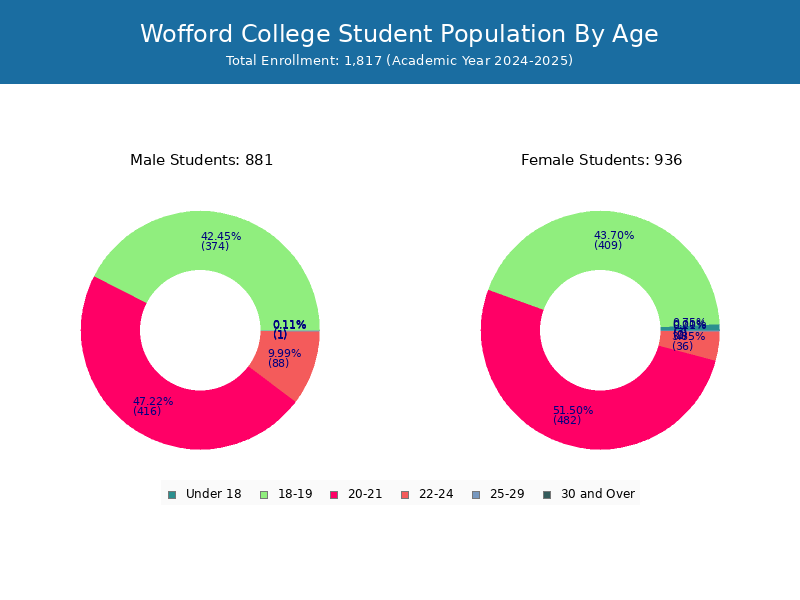
There are 1,821 students under 25 years old, and 2 students over 25 years old out of 1,823 total students.
| Age | Total | Men | Women |
|---|
Transfer-in Students (Undergraduate)
Among 1,823 enrolled in undergraduate programs, 31 students have transferred-in from other institutions. The percentage of transfer-in students is 1.70%.30 students have transferred in as full-time status and 1 students transferred in as part-time status.
| Number of Students | |
|---|---|
| Regular Full-time | 1,777 |
| Transfer-in Full-time | 30 |
| Regular Part-time | 15 |
| Transfer-in Part-time | 1 |