Student Population by Gender
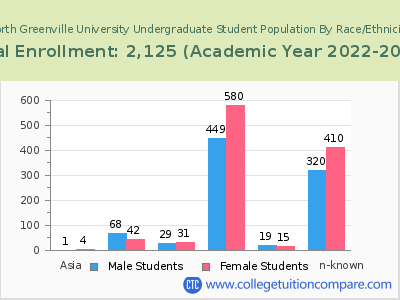
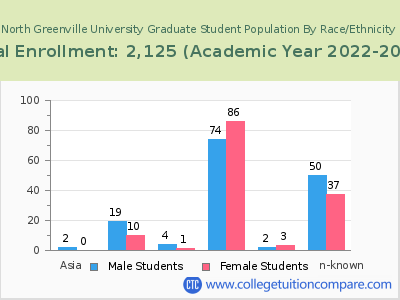
North Greenville University has a total of 2,125 enrolled students for the academic year 2022-2023. 1,839 students have enrolled in undergraduate programs and 286 students joined graduate programs.
By gender, 995 male and 1,130 female students (the male-female ratio is 47:53) are attending the school. The gender distribution is based on the 2022-2023 data.
| Total | Undergraduate | Graduate | |
|---|---|---|---|
| Total | 2,125 | 1,839 | 286 |
| Men | 995 | 846 | 149 |
| Women | 1,130 | 993 | 137 |
Student Distribution by Race/Ethnicity
| Race | Total | Men | Women |
|---|---|---|---|
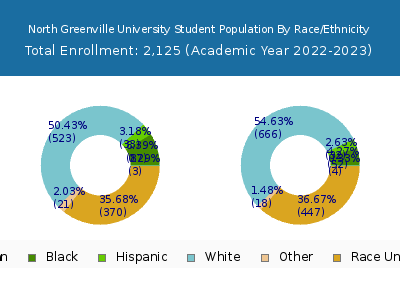
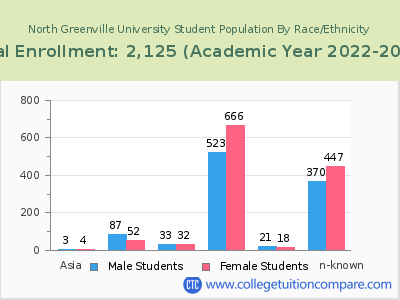
| American Indian or Native American | 4 | 2 | 2 |
| Asian | 17 | 9 | 8 |
| Black | 181 | 123 | 58 |
| Hispanic | 92 | 44 | 48 |
| Native Hawaiian or Other Pacific Islanders | 0 | 0 | 0 |
| White | 1,345 | 576 | 769 |
| Two or more races | 50 | 29 | 21 |
| Race Unknown | 404 | 190 | 214 |
| Race | Total | Men | Women |
|---|---|---|---|
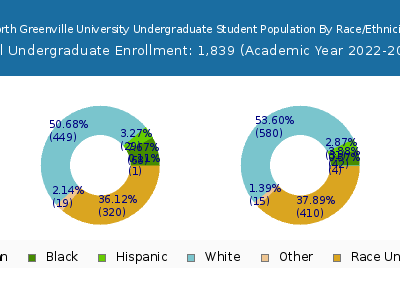
| American Indian or Native American | 3 | 2 | 1 |
| Asian | 15 | 7 | 8 |
| Black | 152 | 102 | 50 |
| Hispanic | 87 | 41 | 46 |
| Native Hawaiian or Other Pacific Islanders | 0 | 0 | 0 |
| White | 1,190 | 500 | 690 |
| Two or more races | 45 | 25 | 20 |
| Race Unknown | 323 | 152 | 171 |
| Race | Total | Men | Women |
|---|---|---|---|
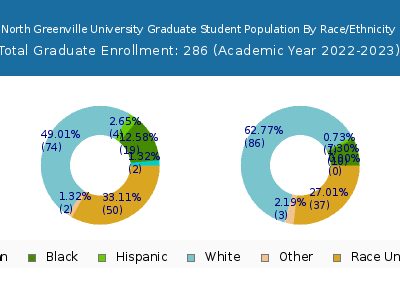
| American Indian or Native American | 0 | 0 | 0 |
| Asian | 0 | 0 | 0 |
| Black | 19 | 10 | 9 |
| Hispanic | 7 | 5 | 2 |
| Native Hawaiian or Other Pacific Islanders | 0 | 0 | 0 |
| White | 103 | 33 | 70 |
| Two or more races | 8 | 6 | 2 |
| Race Unknown | 2 | 1 | 1 |
Student Age Distribution
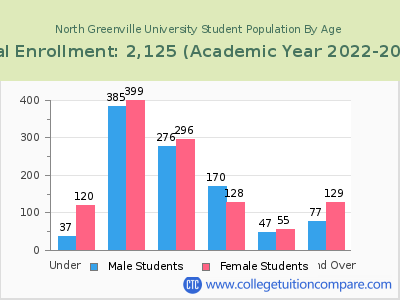
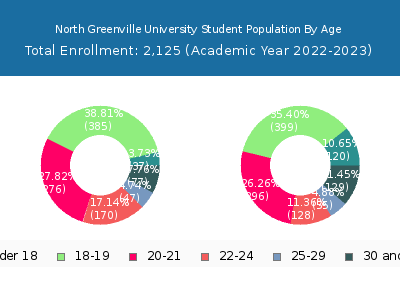
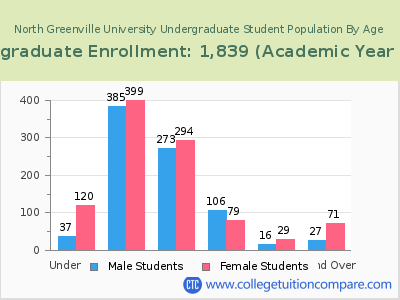
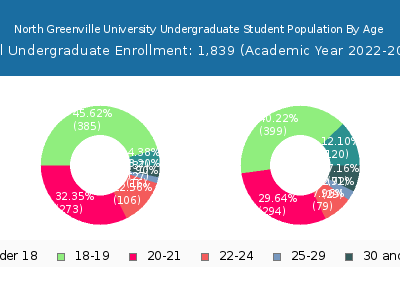
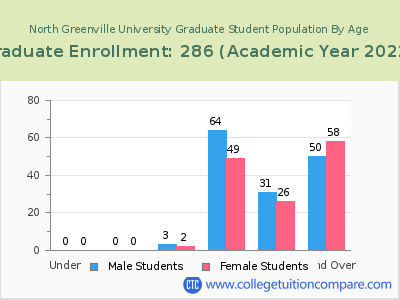
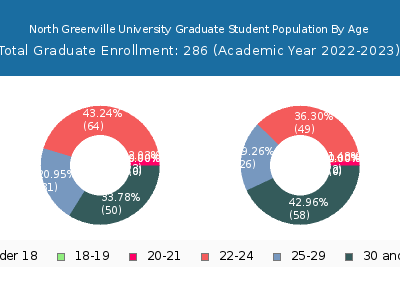
By age, North Greenville has 157 students under 18 years old and 3 students over 65 years old. There are 1,811 students under 25 years old, and 308 students over 25 years old out of 2,125 total students.
North Greenville has 1,693 undergraduate students aged under 25 and 143 students aged 25 and over.
It has 118 graduate students aged under 25 and 165 students aged 25 and over.
| Age | Total | Men | Women |
|---|---|---|---|
| Under 18 | 157 | 120 | 37 |
| 18-19 | 784 | 399 | 385 |
| 20-21 | 572 | 296 | 276 |
| 22-24 | 298 | 128 | 170 |
| 25-29 | 102 | 55 | 47 |
| 30-34 | 53 | 30 | 23 |
| 35-39 | 43 | 33 | 10 |
| 40-49 | 64 | 43 | 21 |
| 50-64 | 43 | 21 | 22 |
| Over 65 | 3 | 2 | 1 |
| Age | Total | Men | Women |
|---|---|---|---|
| Under 18 | 157 | 120 | 37 |
| 18-19 | 784 | 399 | 385 |
| 20-21 | 567 | 294 | 273 |
| 22-24 | 185 | 79 | 106 |
| 25-29 | 45 | 29 | 16 |
| 30-34 | 29 | 19 | 10 |
| 35-39 | 22 | 21 | 1 |
| 40-49 | 29 | 21 | 8 |
| 50-64 | 18 | 10 | 8 |
| Age | Total | Men | Women |
|---|
Online Student Enrollment
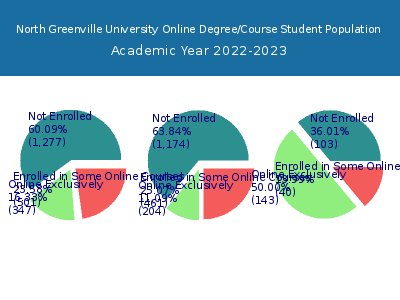
Distance learning, also called online education, is very attractive to students, especially who want to continue education and work in field. At North Greenville University, 347 students are enrolled exclusively in online courses and 501 students are enrolled in some online courses.
295 students lived in South Carolina or jurisdiction in which the school is located are enrolled exclusively in online courses and 52 students live in other State or outside of the United States.
| All Students | Enrolled Exclusively Online Courses | Enrolled in Some Online Courses | |
|---|---|---|---|
| All Students | 2,125 | 347 | 501 |
| Undergraduate | 1,839 | 204 | 461 |
| Graduate | 286 | 143 | 40 |
| South Carolina Residents | Other States in U.S. | Outside of U.S. | |
|---|---|---|---|
| All Students | 295 | 52 | 0 |
| Undergraduate | 187 | 17 | 0 |
| Graduate | 108 | 35 | 0 |
Transfer-in Students (Undergraduate)
Among 1,839 enrolled in undergraduate programs, 147 students have transferred-in from other institutions. The percentage of transfer-in students is 7.99%.136 students have transferred in as full-time status and 11 students transferred in as part-time status.
| Number of Students | |
|---|---|
| Regular Full-time | 1,438 |
| Transfer-in Full-time | 136 |
| Regular Part-time | 254 |
| Transfer-in Part-time | 11 |
