Student Population by Gender
Columbia College has a total of 1,514 enrolled students for the academic year 2022-2023. 1,173 students have enrolled in undergraduate programs and 341 students joined graduate programs.
By gender, 233 male and 1,281 female students (the male-female ratio is 15:85) are attending the school. The gender distribution is based on the 2022-2023 data.
| Total | Undergraduate | Graduate | |
|---|---|---|---|
| Total | 1,514 | 1,173 | 341 |
| Men | 233 | 188 | 45 |
| Women | 1,281 | 985 | 296 |
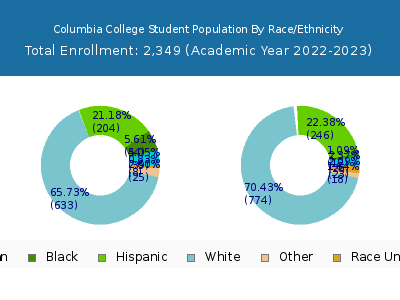
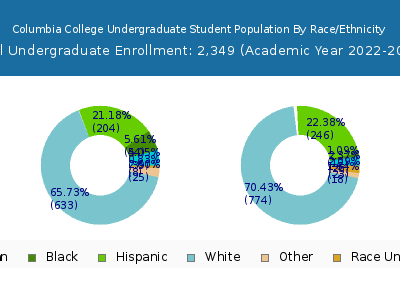
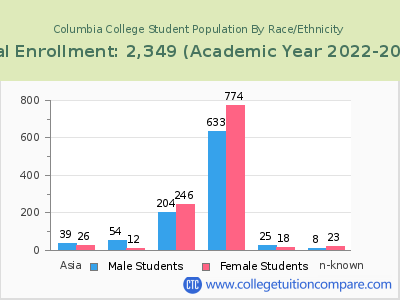
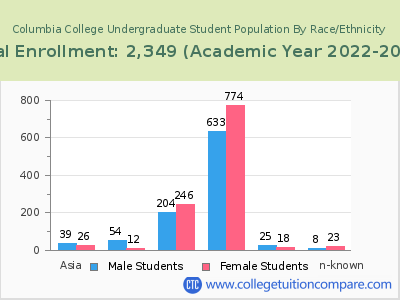
Student Distribution by Race/Ethnicity
| Race | Total | Men | Women |
|---|---|---|---|
| American Indian or Native American | 10 | 3 | 7 |
| Asian | 24 | 4 | 20 |
| Black | 515 | 84 | 431 |
| Hispanic | 137 | 26 | 111 |
| Native Hawaiian or Other Pacific Islanders | 3 | 2 | 1 |
| White | 644 | 89 | 555 |
| Two or more races | 17 | 3 | 14 |
| Race Unknown | 147 | 18 | 129 |
| Race | Total | Men | Women |
|---|---|---|---|
| American Indian or Native American | 9 | 3 | 6 |
| Asian | 21 | 4 | 17 |
| Black | 436 | 68 | 368 |
| Hispanic | 120 | 23 | 97 |
| Native Hawaiian or Other Pacific Islanders | 1 | 1 | 0 |
| White | 452 | 68 | 384 |
| Two or more races | 16 | 3 | 13 |
| Race Unknown | 107 | 14 | 93 |
| Race | Total | Men | Women |
|---|---|---|---|
| American Indian or Native American | 3 | 1 | 2 |
| Asian | 5 | 1 | 4 |
| Black | 66 | 7 | 59 |
| Hispanic | 23 | 3 | 20 |
| Native Hawaiian or Other Pacific Islanders | 0 | 0 | 0 |
| White | 75 | 16 | 59 |
| Two or more races | 0 | 0 | 0 |
| Race Unknown | 10 | 0 | 10 |
Student Age Distribution
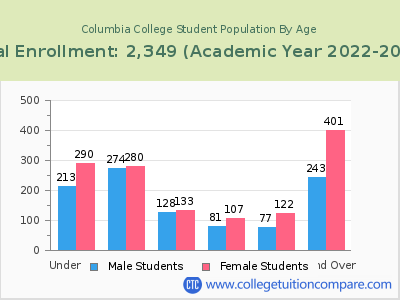
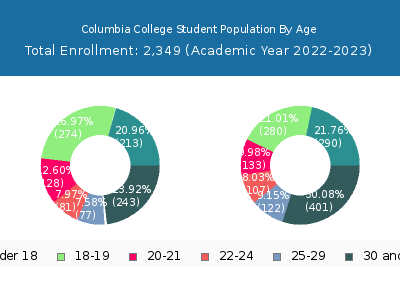
| Age | Total | Men | Women |
|---|---|---|---|
| Under 18 | 5 | 5 | 0 |
| 18-19 | 258 | 200 | 58 |
| 20-21 | 255 | 218 | 37 |
| 22-24 | 225 | 203 | 22 |
| 25-29 | 200 | 175 | 25 |
| 30-34 | 161 | 134 | 27 |
| 35-39 | 143 | 123 | 20 |
| 40-49 | 171 | 142 | 29 |
| 50-64 | 93 | 78 | 15 |
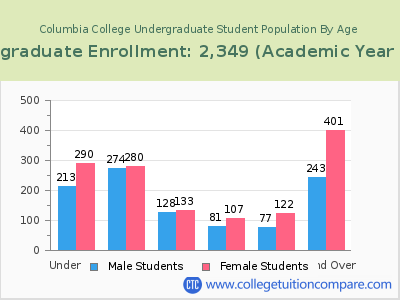
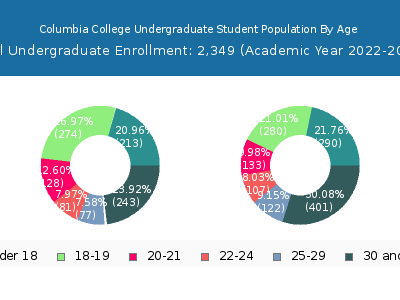
| Age | Total | Men | Women |
|---|---|---|---|
| Under 18 | 5 | 5 | 0 |
| 18-19 | 258 | 200 | 58 |
| 20-21 | 253 | 216 | 37 |
| 22-24 | 175 | 158 | 17 |
| 25-29 | 129 | 113 | 16 |
| 30-34 | 106 | 86 | 20 |
| 35-39 | 90 | 77 | 13 |
| 40-49 | 103 | 83 | 20 |
| 50-64 | 54 | 47 | 7 |
| Age | Total | Men | Women |
|---|
Online Student Enrollment
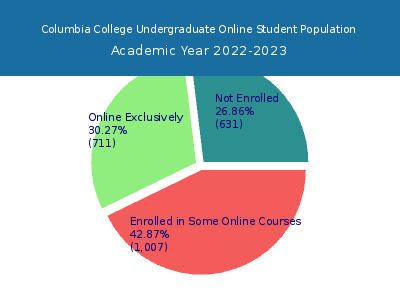
Distance learning, also called online education, is very attractive to students, especially who want to continue education and work in field. At Columbia College, 796 students are enrolled exclusively in online courses and 411 students are enrolled in some online courses.
603 students lived in South Carolina or jurisdiction in which the school is located are enrolled exclusively in online courses and 193 students live in other State or outside of the United States.
| All Students | Enrolled Exclusively Online Courses | Enrolled in Some Online Courses | |
|---|---|---|---|
| All Students | 1,514 | 796 | 411 |
| Undergraduate | 1,173 | 506 | 399 |
| Graduate | 341 | 290 | 12 |
| South Carolina Residents | Other States in U.S. | Outside of U.S. | |
|---|---|---|---|
| All Students | 603 | 189 | 4 |
| Undergraduate | 412 | 94 | 0 |
| Graduate | 191 | 95 | 4 |
Transfer-in Students (Undergraduate)
Among 1,173 enrolled in undergraduate programs, 185 students have transferred-in from other institutions. The percentage of transfer-in students is 15.77%.130 students have transferred in as full-time status and 55 students transferred in as part-time status.
| Number of Students | |
|---|---|
| Regular Full-time | 660 |
| Transfer-in Full-time | 130 |
| Regular Part-time | 328 |
| Transfer-in Part-time | 55 |
