Student Population by Gender
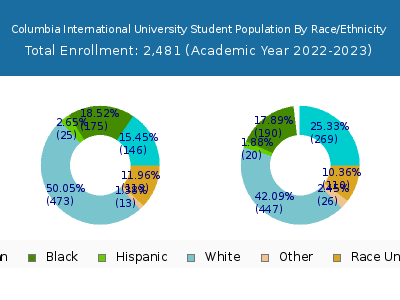
Columbia International University has a total of 2,481 enrolled students for the academic year 2022-2023. 1,001 students have enrolled in undergraduate programs and 1,480 students joined graduate programs.
By gender, 1,142 male and 1,339 female students (the male-female ratio is 46:54) are attending the school. The gender distribution is based on the 2022-2023 data.
| Total | Undergraduate | Graduate | |
|---|---|---|---|
| Total | 2,481 | 1,001 | 1,480 |
| Men | 1,142 | 481 | 661 |
| Women | 1,339 | 520 | 819 |
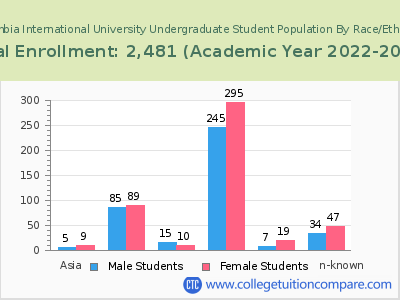
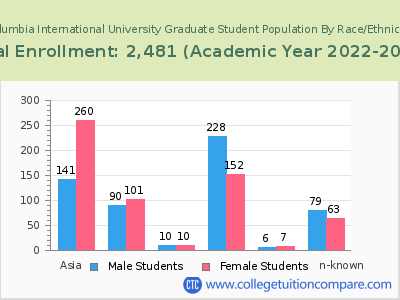
Student Distribution by Race/Ethnicity
| Race | Total | Men | Women |
|---|---|---|---|
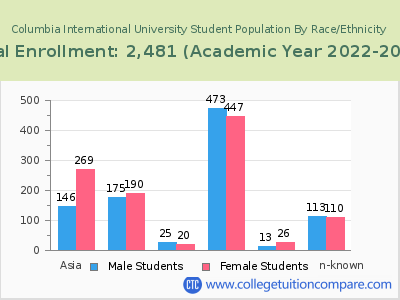
| American Indian or Native American | 4 | 3 | 1 |
| Asian | 325 | 109 | 216 |
| Black | 402 | 183 | 219 |
| Hispanic | 23 | 13 | 10 |
| Native Hawaiian or Other Pacific Islanders | 0 | 0 | 0 |
| White | 1,027 | 530 | 497 |
| Two or more races | 50 | 23 | 27 |
| Race Unknown | 156 | 83 | 73 |
| Race | Total | Men | Women |
|---|---|---|---|
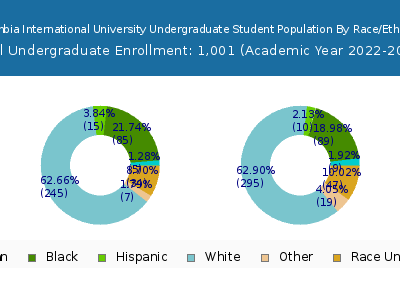
| American Indian or Native American | 3 | 2 | 1 |
| Asian | 20 | 8 | 12 |
| Black | 169 | 78 | 91 |
| Hispanic | 16 | 9 | 7 |
| Native Hawaiian or Other Pacific Islanders | 0 | 0 | 0 |
| White | 642 | 308 | 334 |
| Two or more races | 36 | 15 | 21 |
| Race Unknown | 63 | 28 | 35 |
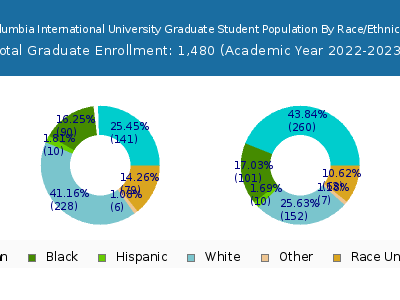
| Race | Total | Men | Women |
|---|---|---|---|
| American Indian or Native American | 0 | 0 | 0 |
| Asian | 1 | 0 | 1 |
| Black | 8 | 2 | 6 |
| Hispanic | 0 | 0 | 0 |
| Native Hawaiian or Other Pacific Islanders | 0 | 0 | 0 |
| White | 34 | 18 | 16 |
| Two or more races | 1 | 0 | 1 |
| Race Unknown | 1 | 0 | 1 |
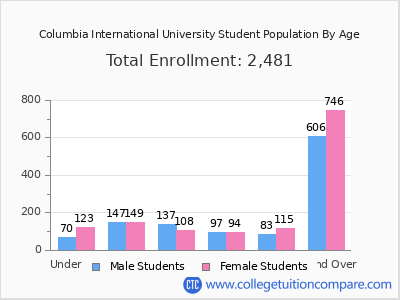
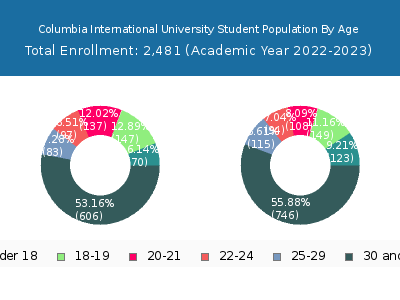
Student Age Distribution
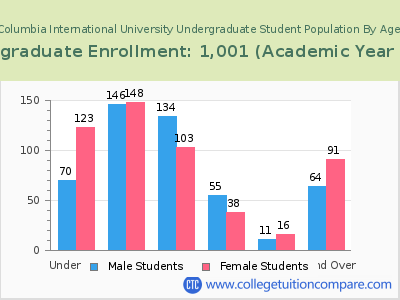
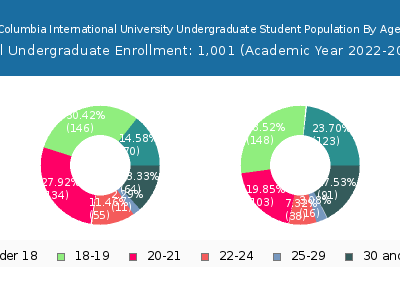
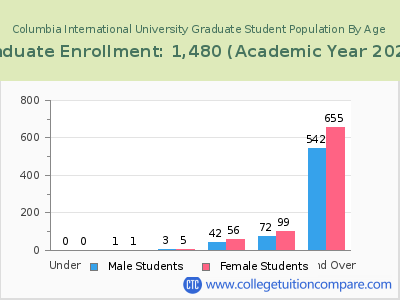
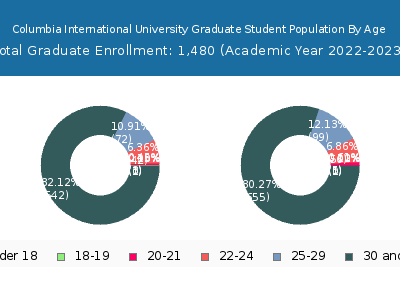
By age, Columbia International has 193 students under 18 years old and 35 students over 65 years old. There are 925 students under 25 years old, and 1,550 students over 25 years old out of 2,481 total students.
In undergraduate programs, 193 students are younger than 18 and 4 students are older than 65. Columbia International has 817 undergraduate students aged under 25 and 182 students aged 25 and over.
It has 108 graduate students aged under 25 and 1,368 students aged 25 and over.
| Age | Total | Men | Women |
|---|---|---|---|
| Under 18 | 193 | 123 | 70 |
| 18-19 | 296 | 149 | 147 |
| 20-21 | 245 | 108 | 137 |
| 22-24 | 191 | 94 | 97 |
| 25-29 | 198 | 115 | 83 |
| 30-34 | 273 | 153 | 120 |
| 35-39 | 285 | 174 | 111 |
| 40-49 | 430 | 239 | 191 |
| 50-64 | 329 | 165 | 164 |
| Over 65 | 35 | 15 | 20 |
| Age | Total | Men | Women |
|---|---|---|---|
| Under 18 | 193 | 123 | 70 |
| 18-19 | 294 | 148 | 146 |
| 20-21 | 237 | 103 | 134 |
| 22-24 | 93 | 38 | 55 |
| 25-29 | 27 | 16 | 11 |
| 30-34 | 31 | 24 | 7 |
| 35-39 | 30 | 18 | 12 |
| 40-49 | 47 | 23 | 24 |
| 50-64 | 43 | 24 | 19 |
| Over 65 | 4 | 2 | 2 |
| Age | Total | Men | Women |
|---|
Online Student Enrollment
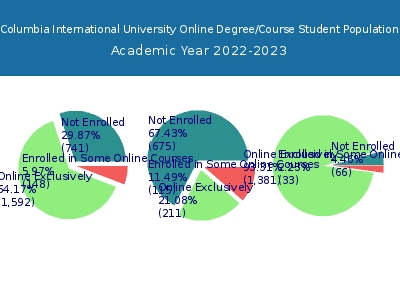
Distance learning, also called online education, is very attractive to students, especially who want to continue education and work in field. At Columbia International University, 1,592 students are enrolled exclusively in online courses and 148 students are enrolled in some online courses.
415 students lived in South Carolina or jurisdiction in which the school is located are enrolled exclusively in online courses and 1,177 students live in other State or outside of the United States.
| All Students | Enrolled Exclusively Online Courses | Enrolled in Some Online Courses | |
|---|---|---|---|
| All Students | 2,481 | 1,592 | 148 |
| Undergraduate | 1,001 | 211 | 115 |
| Graduate | 1,480 | 1,381 | 33 |
| South Carolina Residents | Other States in U.S. | Outside of U.S. | |
|---|---|---|---|
| All Students | 415 | 508 | 669 |
| Undergraduate | 175 | 36 | 0 |
| Graduate | 240 | 472 | 669 |
Transfer-in Students (Undergraduate)
Among 1,001 enrolled in undergraduate programs, 49 students have transferred-in from other institutions. The percentage of transfer-in students is 4.90%.
| Number of Students | |
|---|---|
| Regular Full-time | 515 |
| Transfer-in Full-time | 49 |
