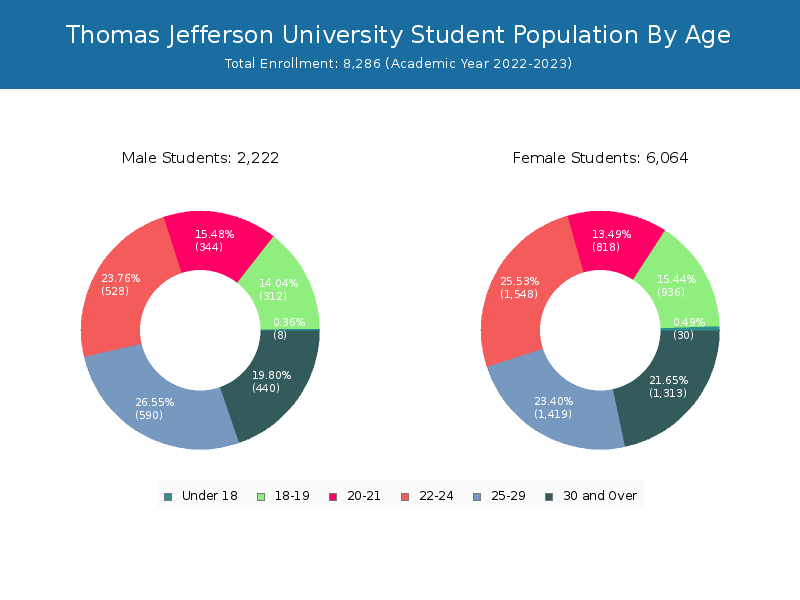
Student Population by Gender
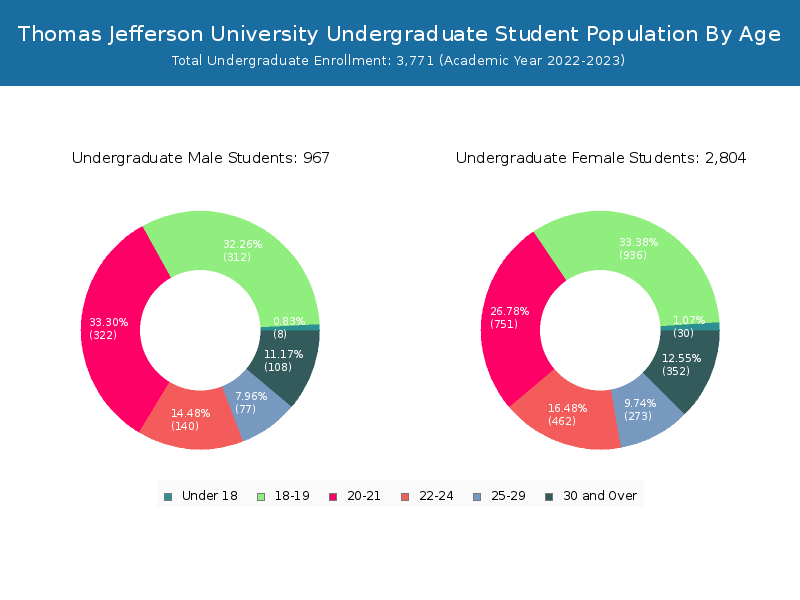
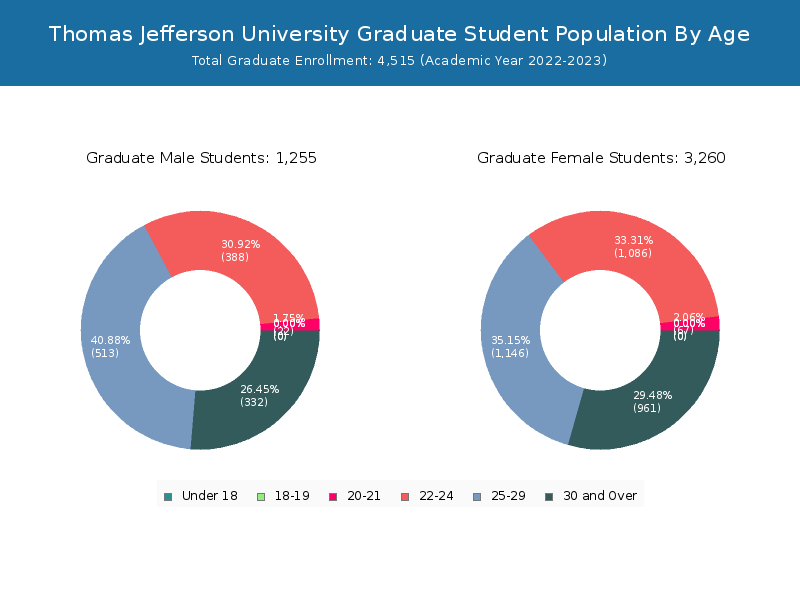
Thomas Jefferson University has a total of 8,286 enrolled students for the academic year 2022-2023. 3,771 students have enrolled in undergraduate programs and 4,515 students joined graduate programs.
By gender, 2,222 male and 6,064 female students (the male-female ratio is 27:73) are attending the school. The gender distribution is based on the 2022-2023 data.
| Total | Undergraduate | Graduate | |
|---|---|---|---|
| Total | 8,286 | 3,771 | 4,515 |
| Men | 2,222 | 967 | 1,255 |
| Women | 6,064 | 2,804 | 3,260 |
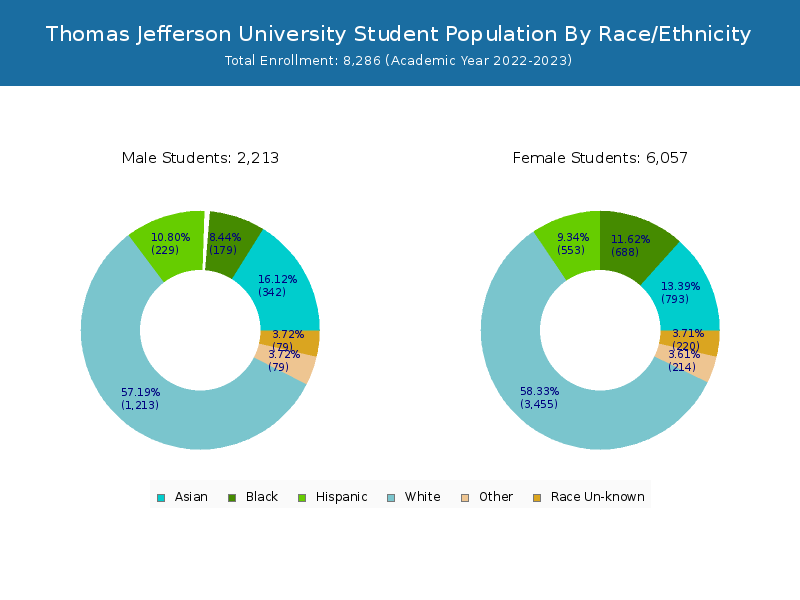
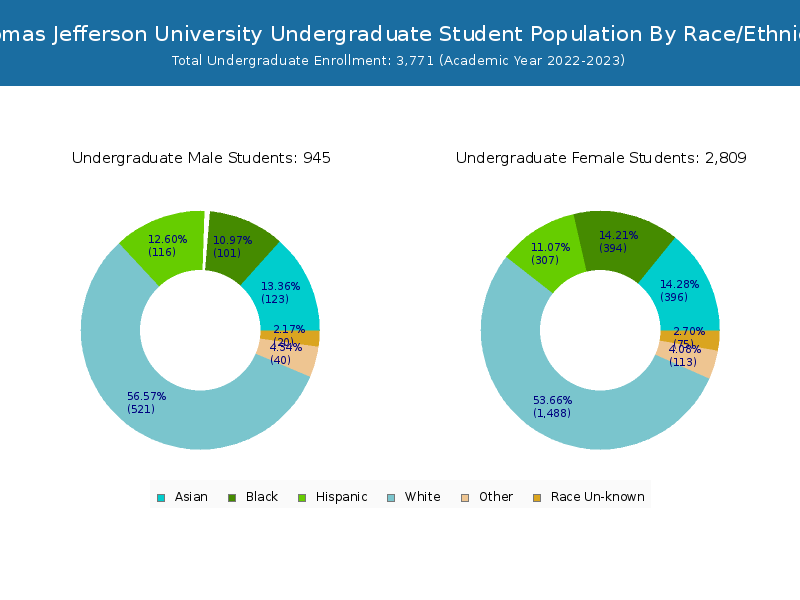
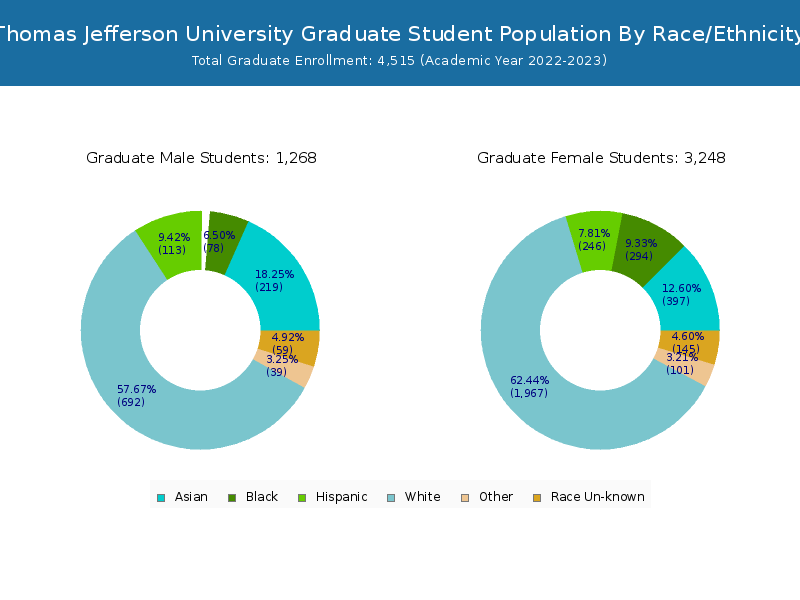
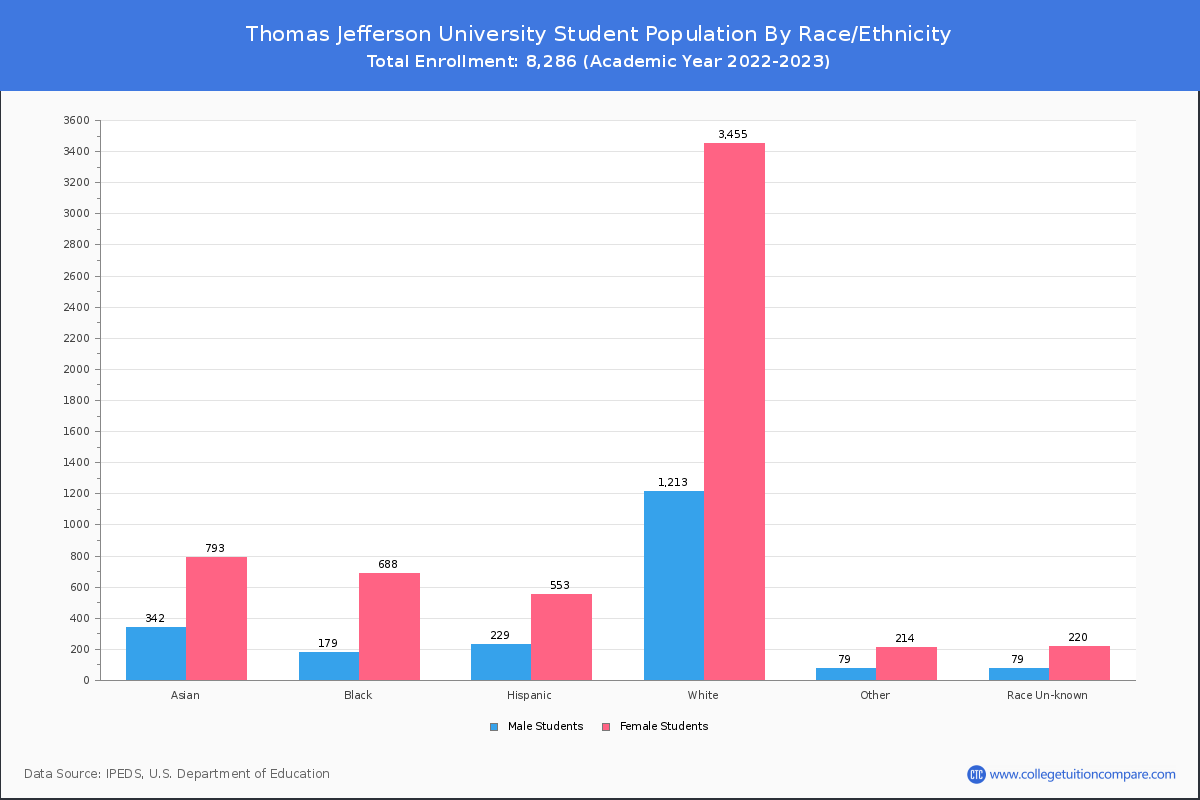
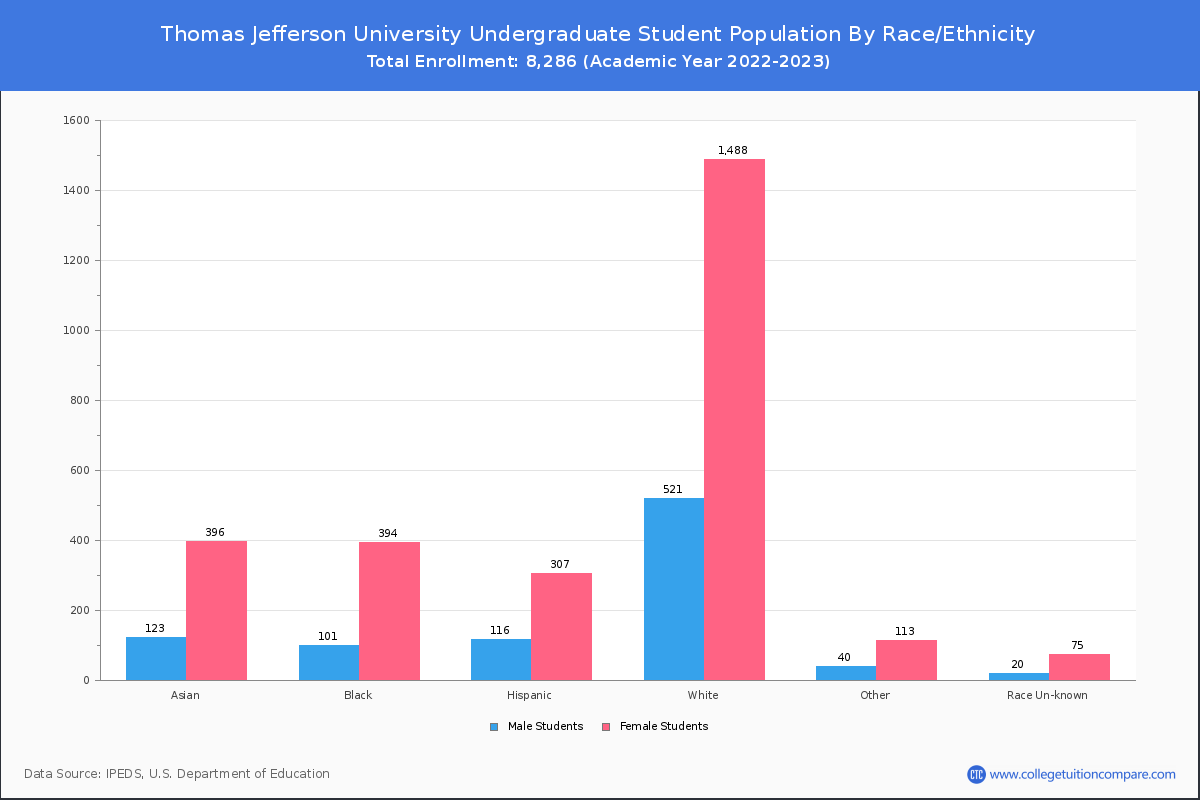
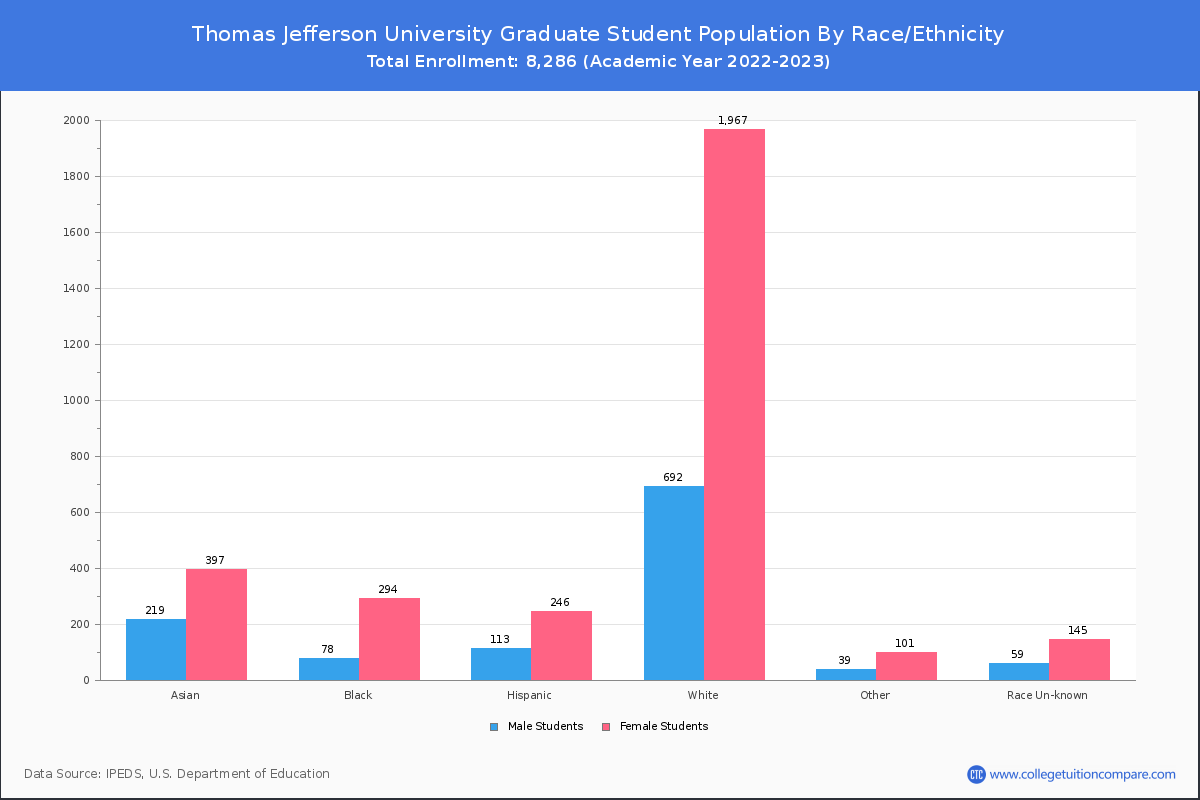
Student Distribution by Race/Ethnicity
By race/ethnicity, 4,373 White, 914 Black, and 1,217 Asian students out of a total of 8,286 are attending at Thomas Jefferson University. Comprehensive enrollment statistic data by race/ethnicity is shown in the next chart (Academic year 2022-2023 data).
| Race | Total | Men | Women |
|---|---|---|---|
| American Indian or Native American | 10 | 5 | 5 |
| Asian | 1,217 | 339 | 878 |
| Black | 914 | 206 | 708 |
| Hispanic | 760 | 222 | 538 |
| Native Hawaiian or Other Pacific Islanders | 2 | 0 | 2 |
| White | 4,373 | 1,137 | 3,236 |
| Two or more races | 362 | 99 | 263 |
| Race Unknown | 241 | 72 | 169 |
| Race | Total | Men | Women |
|---|---|---|---|
| American Indian or Native American | 5 | 2 | 3 |
| Asian | 569 | 132 | 437 |
| Black | 533 | 116 | 417 |
| Hispanic | 437 | 121 | 316 |
| Native Hawaiian or Other Pacific Islanders | 1 | 0 | 1 |
| White | 1,854 | 482 | 1,372 |
| Two or more races | 190 | 52 | 138 |
| Race Unknown | 93 | 27 | 66 |
| Race | Total | Men | Women |
|---|---|---|---|
| American Indian or Native American | 1 | 0 | 1 |
| Asian | 73 | 19 | 54 |
| Black | 133 | 19 | 114 |
| Hispanic | 79 | 18 | 61 |
| Native Hawaiian or Other Pacific Islanders | 0 | 0 | 0 |
| White | 363 | 69 | 294 |
| Two or more races | 42 | 15 | 27 |
| Race Unknown | 17 | 4 | 13 |
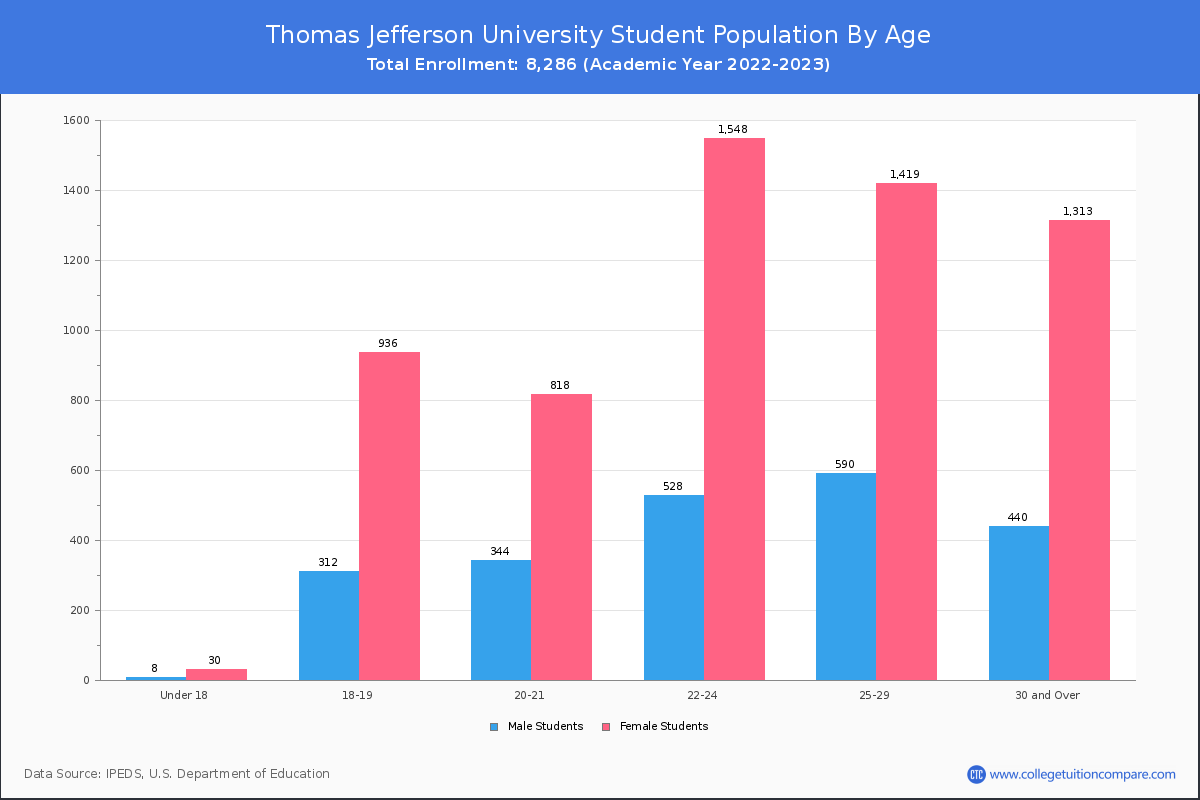
Student Age Distribution
By age, Thomas Jefferson has 38 students under 18 years old and 15 students over 65 years old. There are 4,524 students under 25 years old, and 3,762 students over 25 years old out of 8,286 total students.
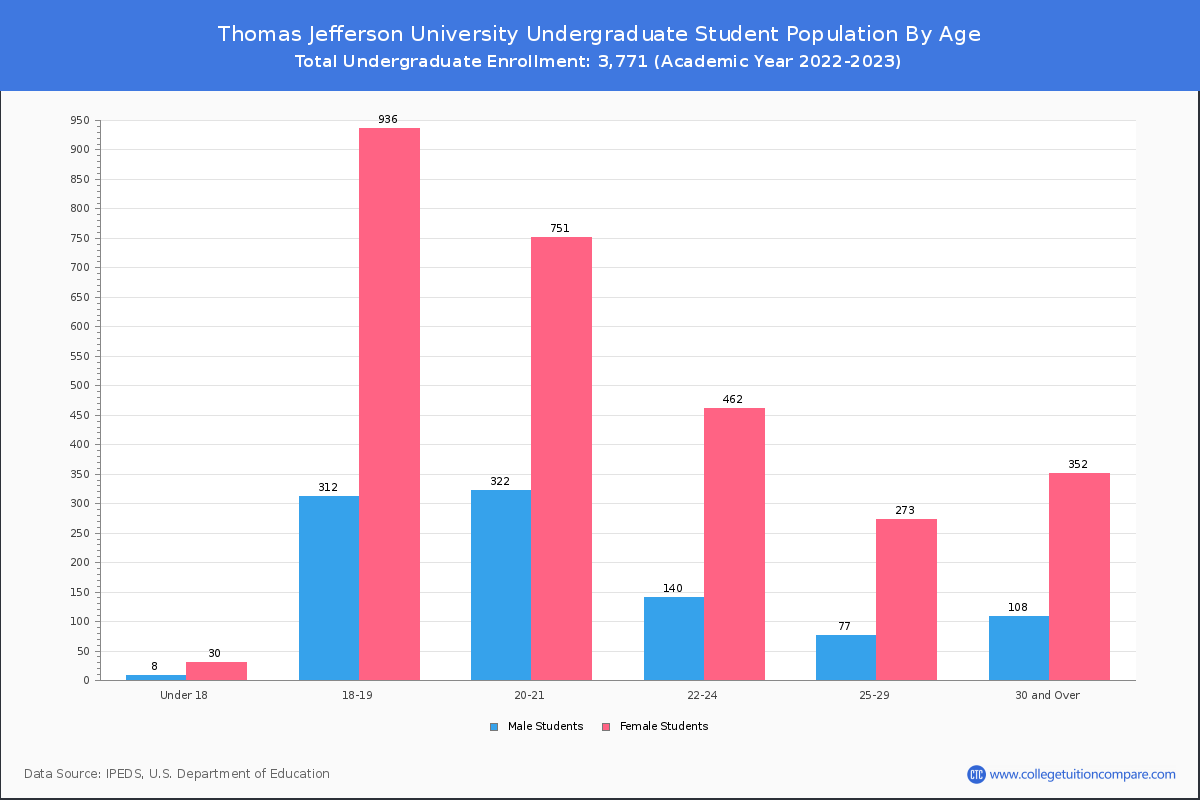
Thomas Jefferson has 2,961 undergraduate students aged under 25 and 810 students aged 25 and over.
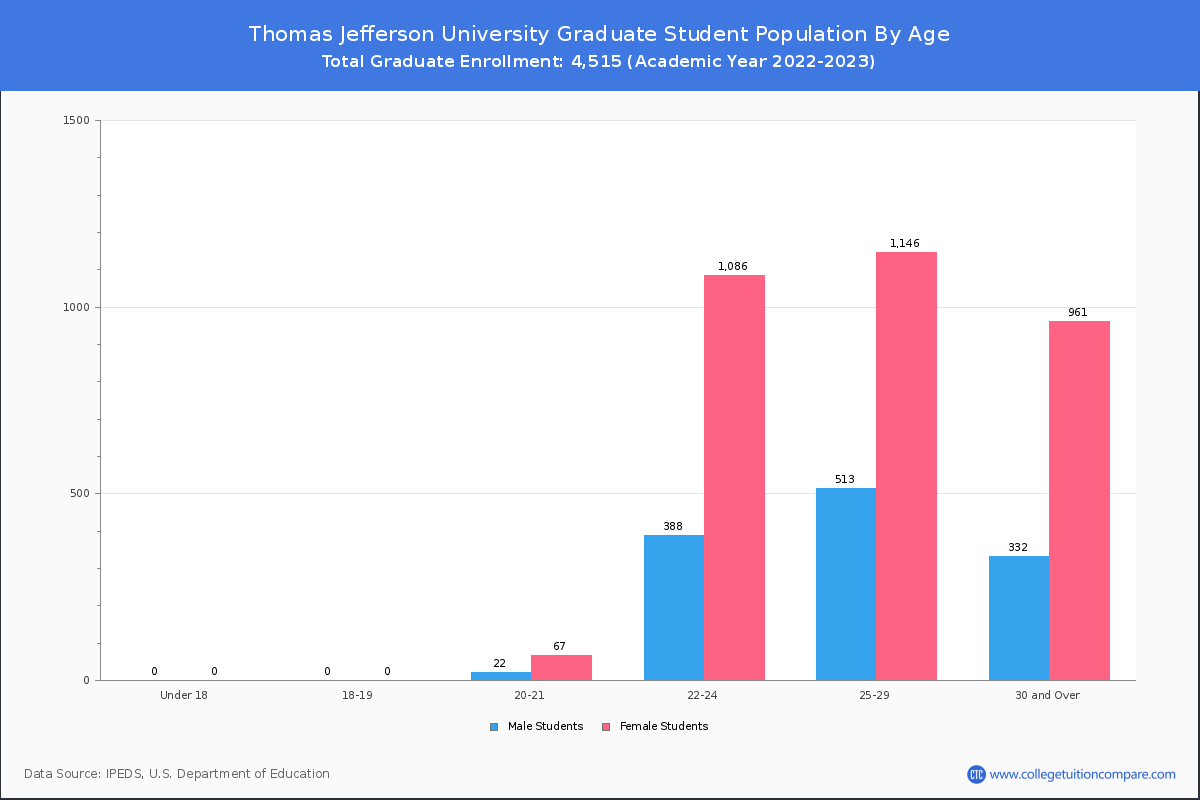
It has 1,563 graduate students aged under 25 and 2,952 students aged 25 and over.
| Age | Total | Men | Women |
|---|---|---|---|
| Under 18 | 38 | 30 | 8 |
| 18-19 | 1,248 | 936 | 312 |
| 20-21 | 1,162 | 818 | 344 |
| 22-24 | 2,076 | 1,548 | 528 |
| 25-29 | 2,009 | 1,419 | 590 |
| 30-34 | 746 | 566 | 180 |
| 35-39 | 408 | 299 | 109 |
| 40-49 | 404 | 305 | 99 |
| 50-64 | 180 | 131 | 49 |
| Over 65 | 15 | 12 | 3 |
| Age | Total | Men | Women |
|---|---|---|---|
| Under 18 | 38 | 30 | 8 |
| 18-19 | 1,248 | 936 | 312 |
| 20-21 | 1,073 | 751 | 322 |
| 22-24 | 602 | 462 | 140 |
| 25-29 | 350 | 273 | 77 |
| 30-34 | 188 | 142 | 46 |
| 35-39 | 109 | 81 | 28 |
| 40-49 | 114 | 90 | 24 |
| 50-64 | 49 | 39 | 10 |
| Age | Total | Men | Women |
|---|
Online Student Enrollment
Distance learning, also called online education, is very attractive to students, especially who want to continue education and work in field. At Thomas Jefferson University, 1,353 students are enrolled exclusively in online courses and 3,056 students are enrolled in some online courses.
849 students lived in Pennsylvania or jurisdiction in which the school is located are enrolled exclusively in online courses and 504 students live in other State or outside of the United States.
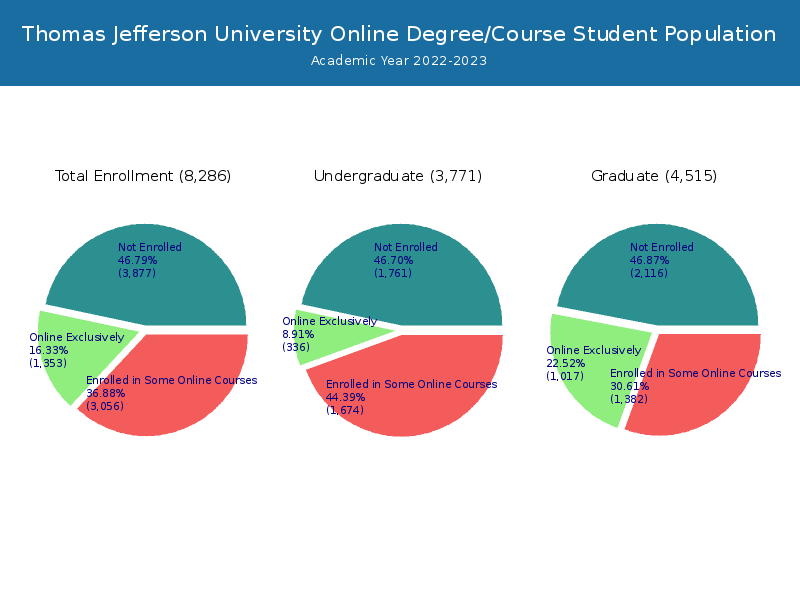
| All Students | Enrolled Exclusively Online Courses | Enrolled in Some Online Courses | |
|---|---|---|---|
| All Students | 8,286 | 1,353 | 3,056 |
| Undergraduate | 3,771 | 336 | 1,674 |
| Graduate | 4,515 | 1,017 | 1,382 |
| Pennsylvania Residents | Other States in U.S. | Outside of U.S. | |
|---|---|---|---|
| All Students | 849 | 482 | 22 |
| Undergraduate | 271 | 63 | 2 |
| Graduate | 578 | 419 | 20 |
Transfer-in Students (Undergraduate)
Among 3,771 enrolled in undergraduate programs, 719 students have transferred-in from other institutions. The percentage of transfer-in students is 19.07%.578 students have transferred in as full-time status and 141 students transferred in as part-time status.
| Number of Students | |
|---|---|
| Regular Full-time | 2,756 |
| Transfer-in Full-time | 578 |
| Regular Part-time | 296 |
| Transfer-in Part-time | 141 |